
Digital currencies all over the deck are capitulating to deepening downward pressure, led by Bitcoin (BTC). After stepping beyond $13,500, the lead crypto failed to hold ground as it slid to $13,000 again. All the major cryptocurrencies especially those in the top 10 are nursing wounds. Ethereum has retreated by almost 10% from its October highs of $421.47 as bears prevail on ETH/USD. Increased selling pressure saw ETH price slide under $380 where it presently struggles to stay afloat. At the time of writing, ETH/USD is teetering at $382.31, down by 2.01% since the day’s start. Ranking 2nd on the Coinmarketcap table, Ethereum has a present market cap of $43.40 billion and $13.80 billion in trade volume over the past 24 hours. On-chain analytics firm, Santiment noticed an emerging trend of Ethereum Miners coin dump after ETH reached a high of $421.5 on October 22. Historically, ETH price goes down when Miners start to move their coins to the exchanges as the selling pressure intensifies.
*Ethereum has retreated by almost 10% from its October highs of $421.47 as bears prevail on ETH/USD
*Increased selling pressure saw ETH price slide under $380 where it presently struggles to stay afloat
*On-chain analytics firm, Santiment noticed an emerging trend of Ethereum Miners coin dump after ETH reached a high of $421.5 on October 22
Key Levels
Resistance Levels: $420, $400, $390
Support Levels: $370, $360, $335
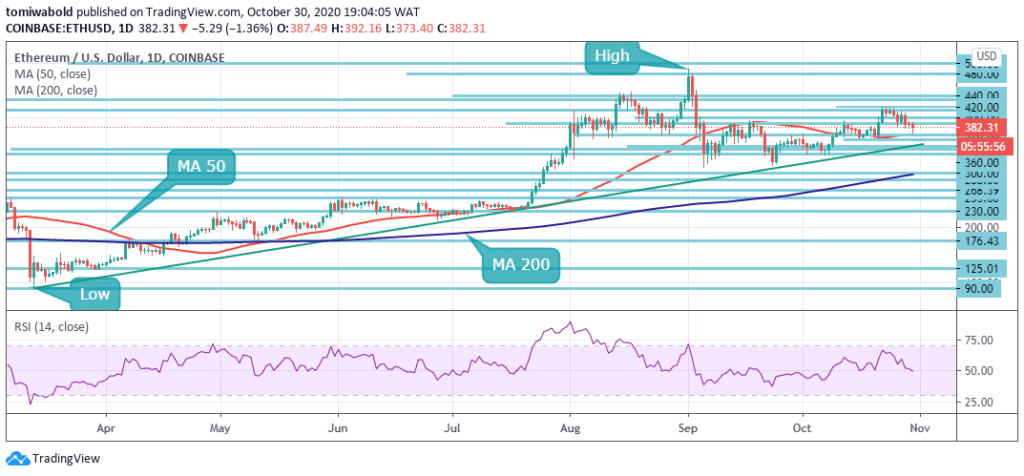 ETH/USD Daily Chart
As seen on the daily chart, the ETH downtrend remained visible since the peak traded on October 22 at $421.47. After a price rejection, ETH breakdown was steady till it reached lows below $380. If the sellers successfully breach beneath the MA 50 coinciding at $370, a push below the ascending trendline may cause ETH to test the support at $360. If the support at $360 caves, ETH could plunge to $335 and $300 where the MA 200 is presently situated.
On the flip side, recovery may ensue as the RSI is presently at midline if the price rebounds above the MA 50 support to reach past $390. This area may be an easy target for the bulls. However, a sustainable move above $420 is required to reinforce a bullish scenario. Once this hurdle is out of the way, ETH can quickly retest $450 and $500.
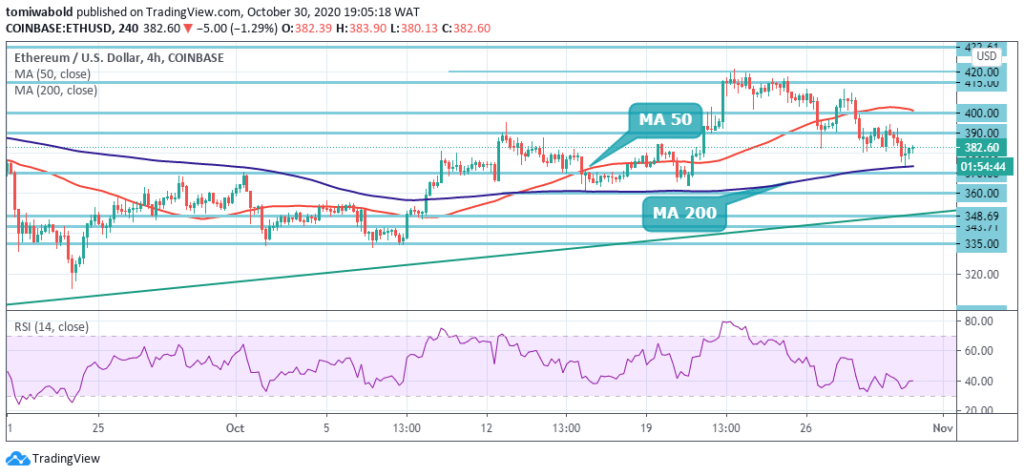 ETH/USD 4-Hour Chart
Ethereum appears vulnerable to further losses after the coin moved below the psychological $380 mark. As seen in the short time frame, ETH rebounded from the channel support at $370 coinciding with the 4 hours MA 200 to trade at its recent price. If it is broken, the sell-off may gain traction with the next focus on short term support at $360 and further at $335.
In the event of a rebound beyond the $380 marks then the ETH/USD pair could easily test back above the $400 resistance zone. The ETH/USD pair is only bullish while exchanging beyond the $370 level, key resistance is found at the $390 and the $400 levels. If the ETH/USD pair trades beneath $370, the $360 and $335 support levels may be tested by sellers.
Note: Kryptomoney.com is not a financial advisor. Do your research before investing your funds in any financial asset or presented product or event. We are not responsible for your investing results
Image Credit: Shutterstock


Keep in mind that we may receive commissions when you click our links and make purchases. However, this does not impact our reviews and comparisons. We try our best to keep things fair and balanced, in order to help you make the best choice for you.
