
In this Ethereum price analysis, the ETHUSD pair will drop to the previous range-bound zone if price retraces and breaks below the $280 price level.
ETHUSD Price Chart
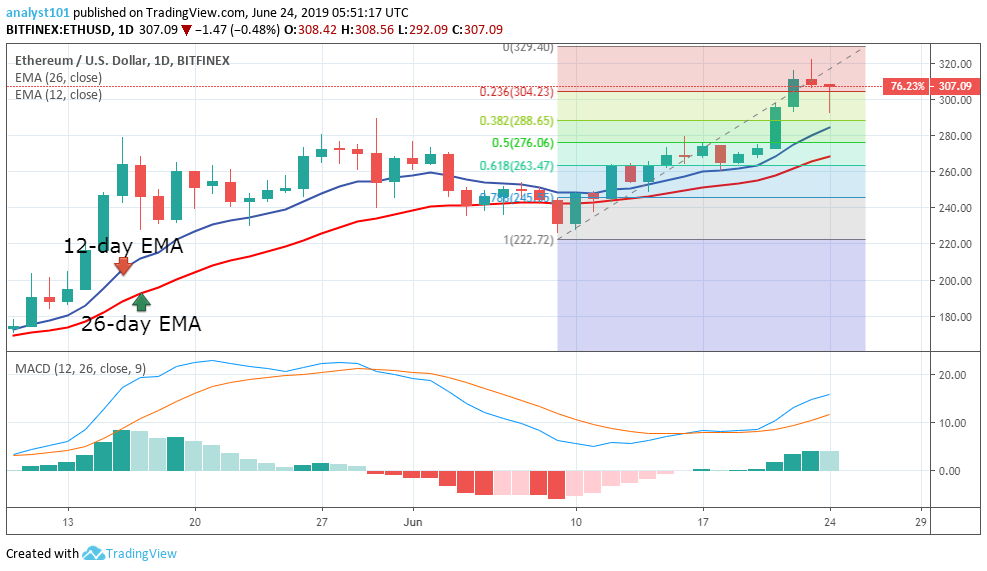
In retrospect, Ethereum (ETH) price was in a bullish trend zone last week as the bulls broke the $280 overhead resistance and reached the $320 price level. At the moment, ETH bulls met resistance at the $320 price level, as a result, Ethereum price is retracing to the support of the 12-day Exponential Moving Average (EMA). On the upside, if Ethereum price retraces to the support of the 12-day EMA, the price of Ethereum will commence its upward move to retest the $320 resistance level.
On the downside, if Ethereum price retraces and breaks below the $280 price level, it will drop to the previous range-bound zone. From the Fibonacci tool, the Ethereum price has retraced and broken the 0.236 (23.6%) Fib.retracement level.
If Ethereum price retraced to the support of the 0.382 (38.2%) Fib. retracement level, the bulls will commence its uptrend move to the previous high. Nevertheless, if the bears break the 0.382 (38.2%) Fib. level, the Ethereum price will be in a downtrend zone. In the meantime, the Moving Average Convergence Divergence (MACD) line and the signal line are above the zero line, indicating a buy signal.
ETHUSD Price Chart
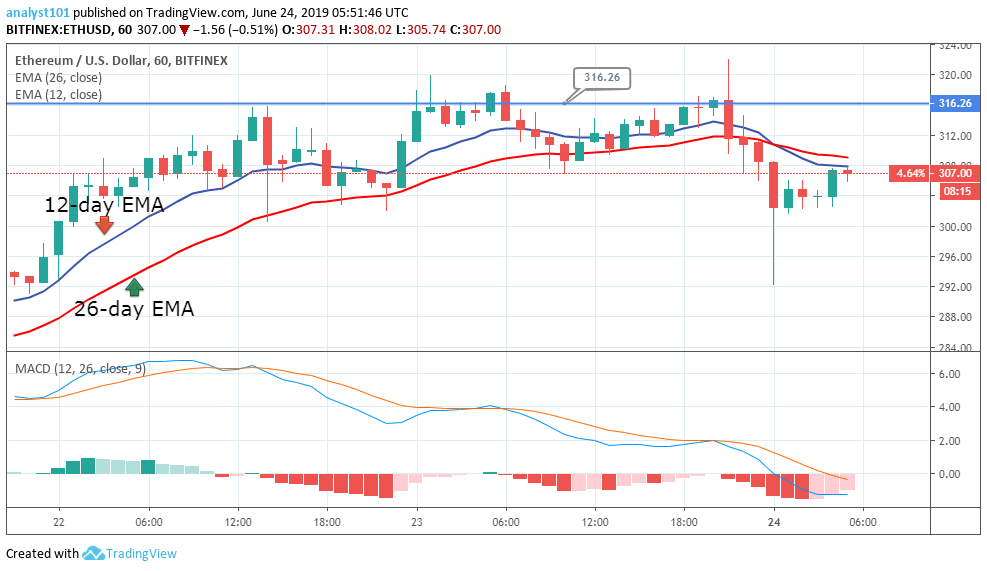
Looking at the 1-hour chart, ETHUSD price is in a bullish trend zone. On June 22 and 23, ETH bulls tested the $316 resistance level but they met resistance. As a result, ETHUSD price declined to the support of the 26-day EMA to commence another upward move.
Yesterday, ETH bulls met another resistance, and again ETHUSD price dropped to the low of $292 but pulled back to resume a range bound move. ETHUSD price is below the EMAs which suggest that price is likely to decline. In the meantime, the MACD line and the signal line are above the zero line which indicates a buy signal.
Arathur Stephen is not registered as an investment adviser with any federal or state regulatory agency. The Information above should not be construed as investment or trading advice and is not meant to be a solicitation or recommendation to buy, sell, or hold any cryptocurrencies. The information is solely provided for informational and educational purposes. Always seek the advice of a duly licensed professional before you make any investment.


Keep in mind that we may receive commissions when you click our links and make purchases. However, this does not impact our reviews and comparisons. We try our best to keep things fair and balanced, in order to help you make the best choice for you.