
Ripple price is at 0.50 Fib. retracement level with the formation of another bearish candlestick. What does this indicate? Can the bulls gain control? Today’s Ripple price prediction reveals.
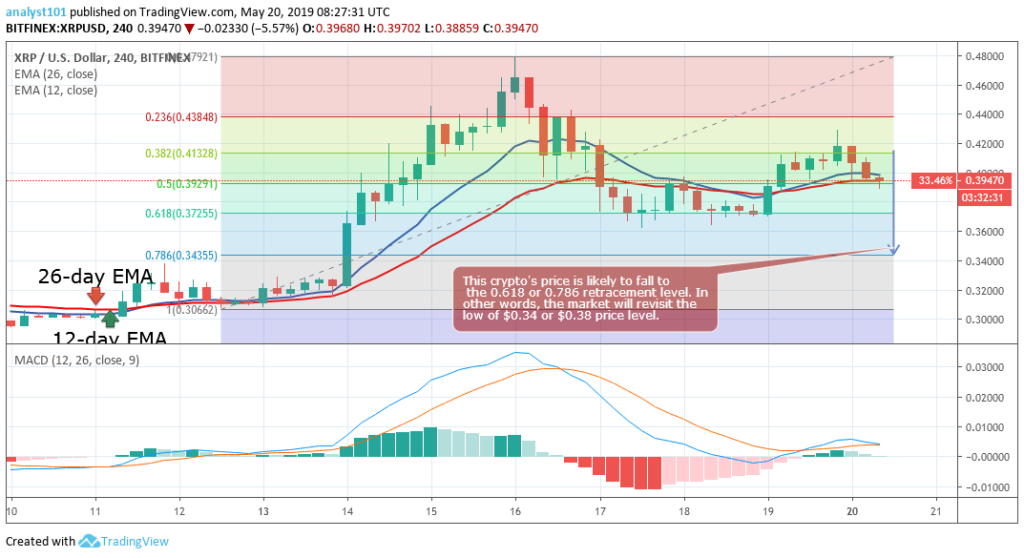
Over the past 7 days, Ripple (XRP) price has been in a bullish trend as it surged and reached a high of around $0.47. However, the crypto’s price has recently rolled over and dropped by 3.28% over the past 24 hours as the bulls were resisted at the $0.46 resistance level and the price fell to the 0.618 Fib. retracement level. This implies that the XRP price is now in the downward trend zone. The bears broke the 0.236 and 0.382 Fib. retracement levels which were the continuation zone of the bullish trend.
Ripple price is at 0.50 Fib. retracement level with the formation of another bearish candlestick, which is an indication that the price is likely to drop to the 0.618 or 0.786 retracement level. This suggests that the market will revisit the lows at $0.34 or $0.38 price level. Nevertheless, the Ripple price made a bullish move but the price fell back to the bearish trend zone. From the price action, the price is above the 12-day and the 26-day Exponential Moving Averages (EMA), indicating that Ripple price is likely to rise.
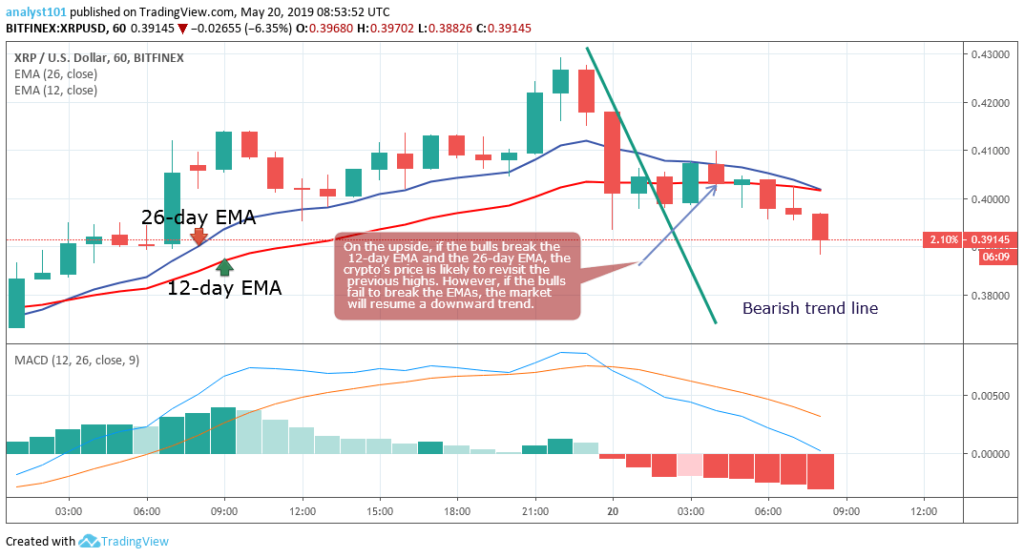
Looking at the 1-hour chart, XRPUSD price is in a bearish trend zone. Yesterday, the price of the coin reached the $0.42 price level and was resisted. As a result, the price of XRP declined to the support of the $0.40 price level which resumed a range bound movement. A bearish candlestick has broken the trend line terminating the ongoing bearish trend.
On the upside, if XRP bulls break the 12-day and the 26-day EMAs, XRPUSD price is likely to climb to the previous high. On the other hand, if the bulls are unable to break the EMAs, the market will commence a downward trend. In the meantime, the MACD line, as well as the signal line, are above the zero line which indicates a buy signal.
Arathur Stephen is not registered as an investment adviser with any federal or state regulatory agency. The Information above should not be construed as investment or trading advice and is not meant to be a solicitation or recommendation to buy, sell, or hold any cryptocurrencies. The information is solely provided for informational and educational purposes. Always seek the advice of a duly licensed professional before you make any investment.


Keep in mind that we may receive commissions when you click our links and make purchases. However, this does not impact our reviews and comparisons. We try our best to keep things fair and balanced, in order to help you make the best choice for you.
