
The cryptocurrency market recovery is gradually picking pace but BTC still struggles to break past $19,500. BTC consolidation has led to some Altcoins surging significantly in the past 24 hours. AAVE, the native token of Aave is up 9.22% on a 24-hour basis. Aave price boosted on the news of Coinbase Pro listing. Aave has been inside a robust uptrend since its token swap from LEND to AAVE on October 20. AAVE consequently set its all-time high of $96.53 on Dec 03, 2020. AAVE’s uptrend suffered setbacks amid a broad-based market sell-off on December 8. Aave’s recovery picked pace when it embraced support at $70.13 while bringing it in a close shave with $93. AAVE presently trades $87.78. The crypto asset ranks 27th on the Coinmarketcap table, with a market cap of $1.05 million and $347 million in trade volume over the past 24 hours. Aave token is listed on Coinbase Pro, the platform focused on professional traders presently, users can transfer the coins to their accounts. However, the trading functionality will be unlocked today Tuesday, December 15, at 9 AM PT provided that the token gathers enough liquidity.
*AAVE consequently set its all-time high of $96.53 on Dec 03, 2020
*AAVE/USD presently trades at $87
*Aave token is listed on Coinbase Pro, the platform focused on professional traders
Key Levels
Resistance Levels: $100.00, $96.53, $90.83
Support levels: $78.99, $70.13, $60.00
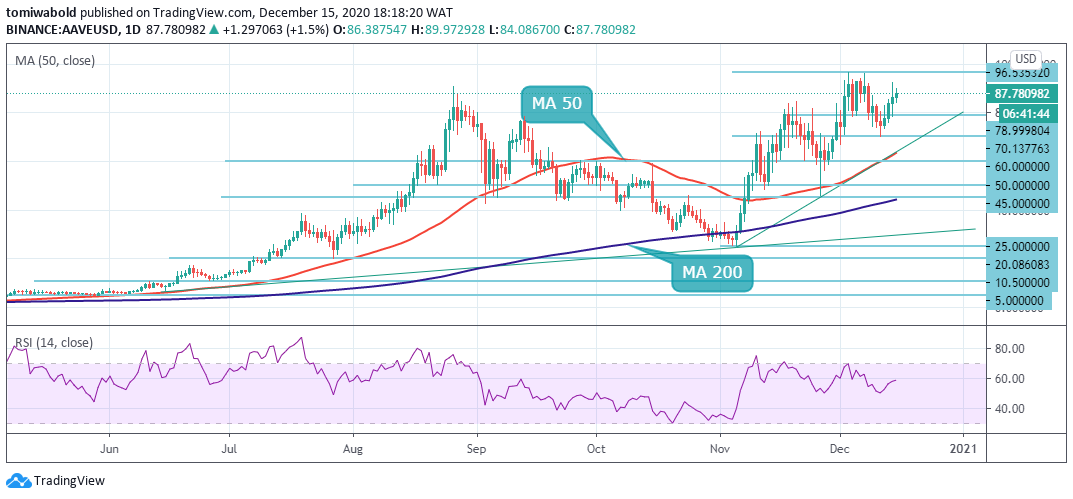 AAVE/USD Daily Chart
Aave has been trading within an ascending trend line since when it bottomed at $24.64 on November 5. The price turned down after rejection at the $90 barrier on December 8, but the bulls managed to buy the dip to $92 before taking a breather. If the bulls regain back strength, the first target on the upside is a retest of the highs past $96.53 after which the next leg of the uptrend could begin.
In a further move, a breach of the $100 psychological level may cause the AAVE/USD pair to rise to the $112 resistance level. On the downside, if the price turns down from current levels at $87, the pair may retest the support of the ascending trend line at $70.13. If the price dips below the $70.13 support, such a move will suggest the favor has shifted to the bears and may lead to a retest of the MA 50 close at $63.45.
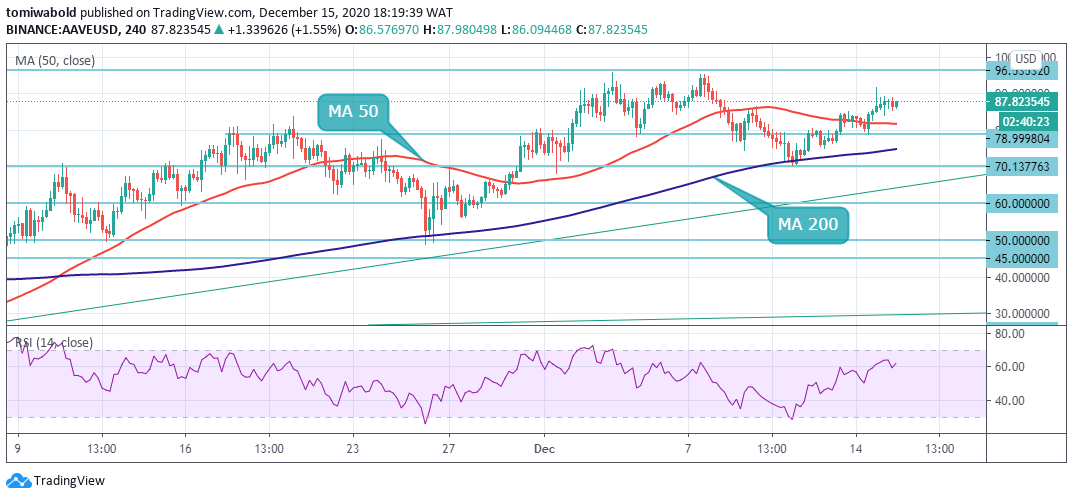 AAVE/USD 4-Hour Chart
AAVE/USD reclaimed the 4 hour MA 50 support on December 14. AAVE presently trades above the two MAs indicating an optimistic outlook. The bears are attempting to stall the rally at $87, if this occurs, AAVE/USD pair may retest the MA 50 support at $82. in an extended sell-off, there is a possibility of a retest of the MA 200 at $75.
Meanwhile on the flip side, if the $78.99 support level holds intact, the AAVE/USD pair is only bullish while trading above the $70.13 horizontal support zone, key resistance is found at the $90.83 and the $96.53 levels. If the AAVE/USD pair trades below the $70.13 level, sellers may test the $60 and $50 levels.
Note: Kryptomoney.com is not a financial advisor. Do your research before investing your funds in any financial asset or presented product or event. We are not responsible for your investing results
Image Credit: Shutterstock


Keep in mind that we may receive commissions when you click our links and make purchases. However, this does not impact our reviews and comparisons. We try our best to keep things fair and balanced, in order to help you make the best choice for you.
