After major declines during the week, most crypto assets are looking forward to ending the week on a positive note. BTC leads the rest of the market in a collective rebound, trading back above $53k. Since attaining highs of $1.51 on Mar. 18, Cardano price has been in a persistent downtrend. Cardano’s (ADA) price dipped towards the $1.03 support on March 25 before the bulls bought the dip. A bounce from downtrend lows of $1.03 brings Cardano’s price up by 9.16% within the last 24 hours. ADA presently trades at $1.21, although still down by 9.63% on the weekly. With a market capitalization of $38.7 billion and $7.1 billion in trade volume over the past 24hrs, Cardano has reclaimed a fourth place on the CoinMarketCap table. Charles Hoskinson, CEO of IOHK revealed that the Alonzo Testnet which will onboard smart contracts to the Cardano (ADA) blockchain, could go live as soon as April. The CEO also said that he is exploring ways to incorporate NFTs into the Cardano network. Stating that he has already approached some of the top-10 NFT marketplaces about porting over to the network from Ethereum.
*Cardano price has been in a persistent downtrend
*ADA presently trades at $1.21
*The Alonzo Testnet which will bring smart contracts to the Cardano (ADA) blockchain, could go live as soon as April
Key Levels
Resistance Levels: $1.6000, $1.5472, $1.4000
Support Levels: $1.1000, $1.0275, $0.9847
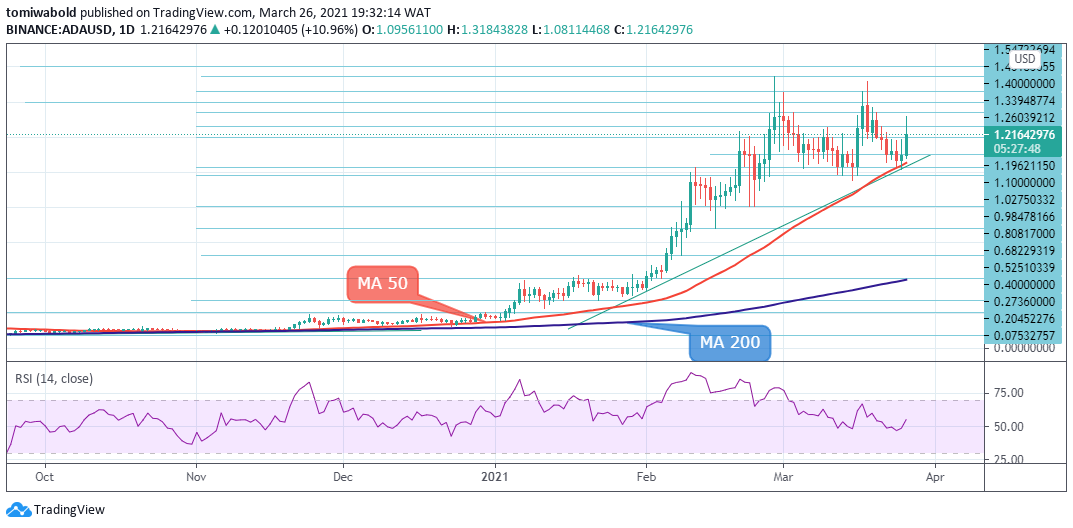 ADA/USD Daily Chart
Support was embraced at $1.03, whereby bulls took control of the trend. ADA/USD is tackling the $1.31 level as seen in the intraday high which happens to fall within a resistance range. If the bulls manage to push the ADA price back above the $1.31 level, the ADA/USD pair may start its journey towards the upper part of the resistance range at $1.51.
Oscillators are transmitting mixed signals in directional momentum. However, the RSI just above the midpoint suggests a few days of consolidation. If the price turns down from the current level and slides beneath the MA 50 at $1.05, it could attract further selling from the bears. That could result in a drop to $0.95 and then $0.80.
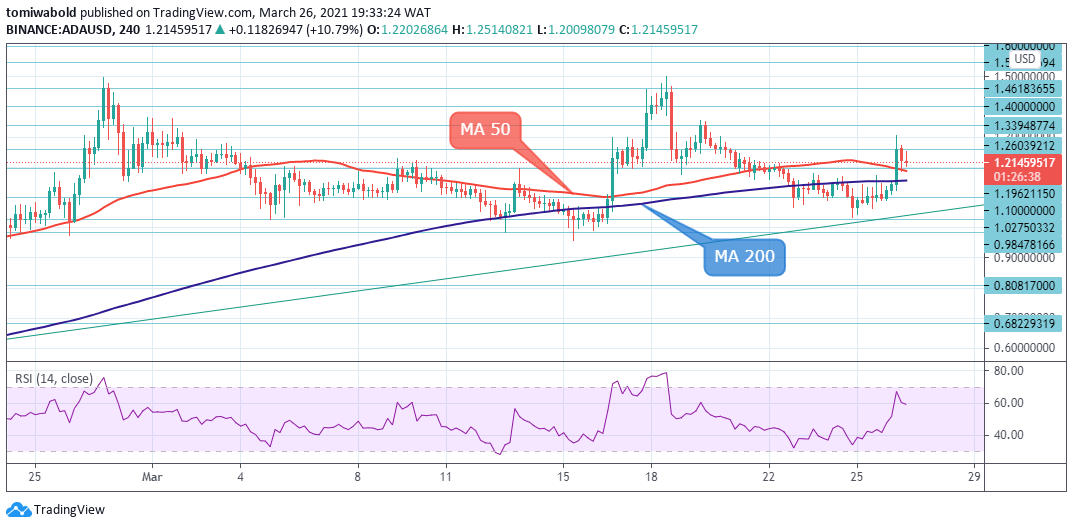 ADA/USD 4-Hour Chart
Bullish acceleration extends into the second day and breaks through the critical barrier located at the MA 200 ($1.15 ) and the MA 50 ($1.19). An eventual weekly close above the MA 50 ($1.19) would add more to bullish credence. The ADA/USD pair has now performed an important bearish technical breakout from a rising price.
Bulls approach targets at $1.35 (18th Mar high) and intermediate resistance at $1.31 level, a break of which would open the way for a retest of yearly highs at $1.54. Technically, a break below the MA 50 at $1.19 suggests resumption of a downswing targetting the MA 200 at $1.15. A sustained break of MA 200 will bring deeper correction to further retracement at $1.03 and $0.95.
Note: Kryptomoney.com is not a financial advisor. Do your research before investing your funds in any financial asset or presented product or event. We are not responsible for your investing results
Image Credit: Shutterstock


Keep in mind that we may receive commissions when you click our links and make purchases. However, this does not impact our reviews and comparisons. We try our best to keep things fair and balanced, in order to help you make the best choice for you.