The cryptocurrency market has been on fire lately with BTC breaking past $18,000 and all major Altcoins gaining ground. ADA bottomed at $0.0753 on September 23 as the price failed to clear the barrier at $0.1150. In a bullish move that kickstarted when ADA price bounced from the key support at $0.1025, breakout on ADA/USD marks a 3-month high at $ 0.1326. ADA has been trading in the green for the last two days, gaining 18.23% daily and 25.87% on a seven-day basis. At the time of writing, ADA/USD is trading at $0.1292, after setting intraday highs of 0.1326, a level last traded since August 21. The market cap is ranked 10th on the Coinmarketcap table and currently stands at $4.04 billion, with $1.25 billion in trade volume over the past 24 hours. IntoTheBlock’s “Daily Active Addresses” model reveals Cardano’s new addresses have spiked with more than 7,000 new addresses joining the network daily.
*ADA bottomed at $0.0753 on September 23 as the price failed to clear the barrier at $0.1150
*ADA has been trading in the green for the last two days, gaining 18.23% daily and 25.87% on a seven-day basis
*At the time of writing, ADA/USD is trading at $0.1292, after setting intraday highs of 0.1326, a level last traded since August 21
Key Levels
Resistance Levels: $0.1719, 0.1520, $0.1326
Support Levels: $0.1150, $0.1000, $0.0890
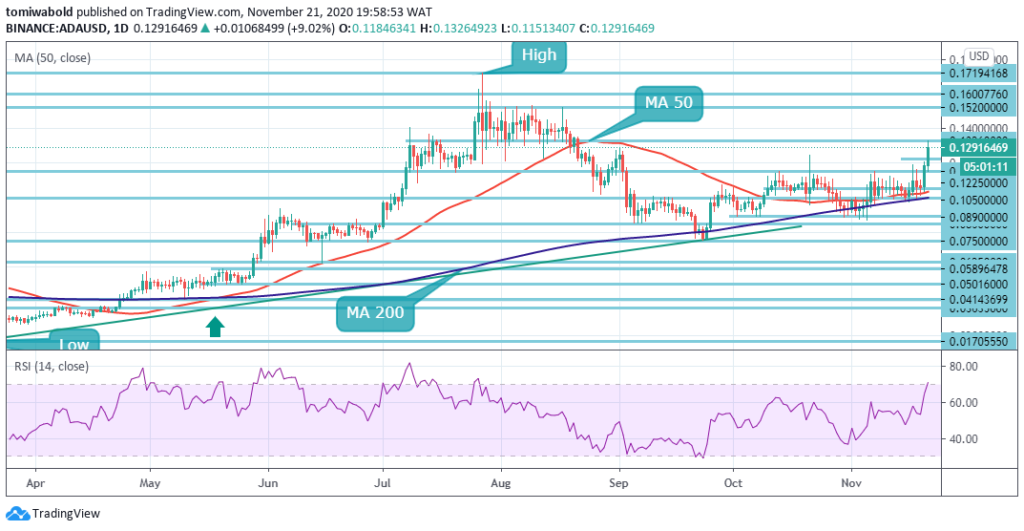 ADA/USD Daily Chart
On the daily chart, ADA rebounded from the $0.1025 level at the MA 50 support, climbing past the key resistance at $0.1150 to highs of $0.1326. The upsloping moving averages and the RSI in the positive zone suggest that bulls have the upper hand. A sustainable move above $0.1326 may cause the pair to retest the key resistance at $0.1520 and ultimately its late July high of $0.1719.
On the flip side, if the pair turns down from the resistance above $0.1326, a range-bound action may ensue for a few days. A breach below $0.1025 at the daily MA 50 will invalidate the bullish outlook and bring $0.098 at the MA 200 into focus.
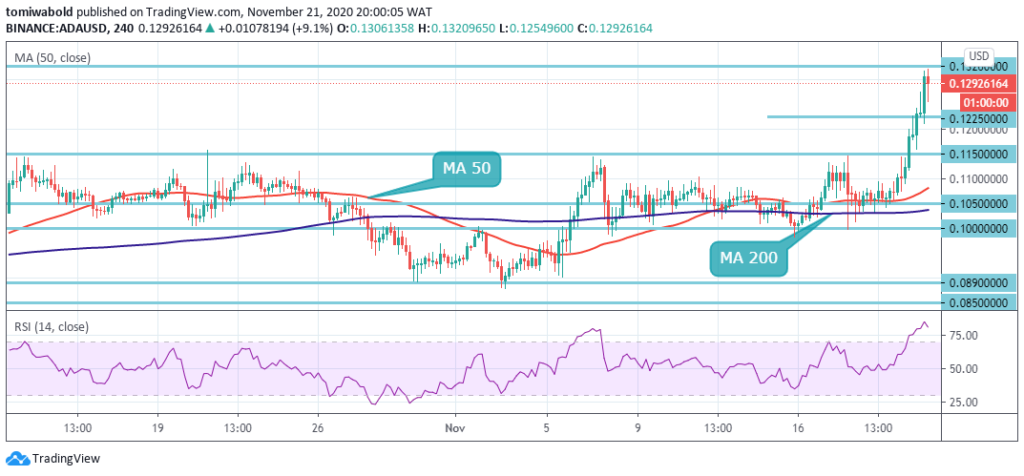 ADA/USD 4-Hour Chart
After a short consolidation, ADA resumed its recovery on Nov. 20, regaining losses during the prior sell-off. A strong move above the MA 50 close at $0.1055 created a bullish drive which pushes the price to highs of $0.1317. Sellers’ pressure is seen at $0.1326, however, support is envisaged at $0.1225 slightly below where it trades.
Immense selling pressure may cause ADA to test the MA 50 support at $0.1078 and $0.1037 at the MA 200 support. On the upside, a sustained move past $0.1326 will bring further upside gains. The ADA/USD pair is only bullish while trading above the $0.1150 level, key resistance is found at the $0.1326 and the $0.1520 levels. If the ADA/USD pair trades below the $0.1150 level, sellers may test the $0.1000 and $0.0890 levels.
Note: Kryptomoney.com is not a financial advisor. Do your research before investing your funds in any financial asset or presented product or event. We are not responsible for your investing results
Image Credit: Shutterstock


Keep in mind that we may receive commissions when you click our links and make purchases. However, this does not impact our reviews and comparisons. We try our best to keep things fair and balanced, in order to help you make the best choice for you.