Over the weekend a broad-based sell-off in the Cryptosphere left most of the crypto giants priced mostly in red. While ADA/USD even now is exchanging beneath its recent highs, today the pair has bounced off session lows to drive up 5.8 percent. Cardano (ADA) is 11th and also one of the highest-performing cryptocurrency assets in 2020, it is now approximately $500 million further from recovering a place among the top 10 cryptocurrencies with a total $1.406 billion market cap. The estimated daily trading volume of $178 million proves that ADA/USD activity has been steady. Cardano (ADA) reached $0.0549 intraday high as price reinforces bullish traction to $0.0550 by press time. The latest Cardano Explorer has now been released, built on the revised Byron reboot infrastructure. IOHK further said the current explorer is a huge upgrade from the initial and is one of the final changes to the Shelley mainnet.
*While ADA/USD even now is exchanging beneath its recent highs, today the pair has bounced off session lows to drive up 5.8 percent
*Cardano (ADA) reached $0.0549 intraday high as price reinforces bullish traction to $0.0550 by press time
*The latest Cardano Explorer has now been released, built on the revised Byron reboot infrastructure
Key Levels
Resistance Levels: $0.0657, $0.0600, $0.0550
Support Levels: $0.0500, $0.0457, $0.0400
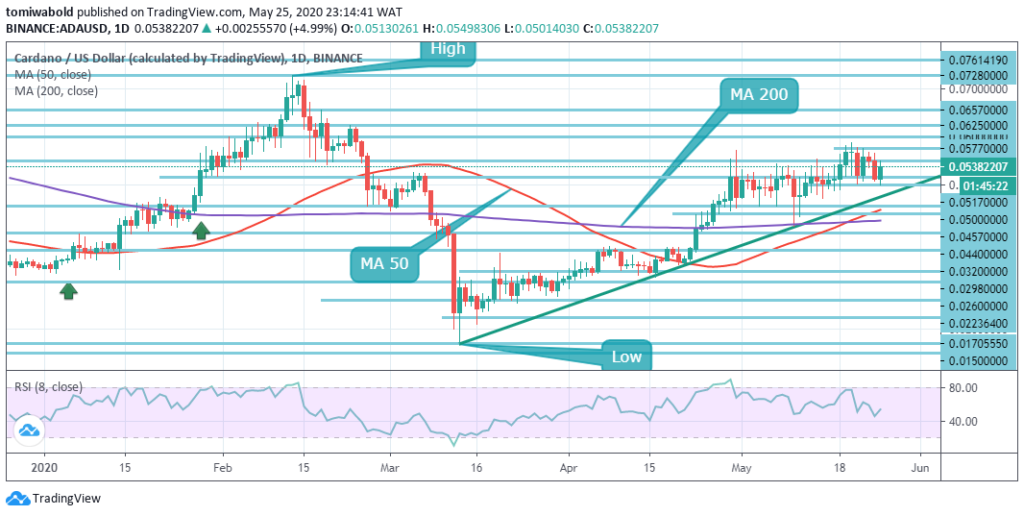 ADA/USD Daily Chart
Cardano (ADA) has resumed a gradual increase amid the broad-based sell-off in the Cryptosphere. A pivotal $0.0500 emerged as a strong level of support that halted the slump and sparked the rebound. The next resistance is established in the horizontal resistance level clustered around $0.0550, by the sellers’ confluence zone. Once it’s out of the path, the upside is likely to gain traction with $0.0600 being the next priority.
A stable shift beyond this level may strengthen the medium-term perspective and allow the shift to a region of $0.0600-$0.0625 that emerged as a consolidation region in late February. On the contrary, the decline may halt at $0.0500, because it is also supported by the ascending trendline support, but once breached, the sell-off will gain traction with the next emphasis on $0.0457.
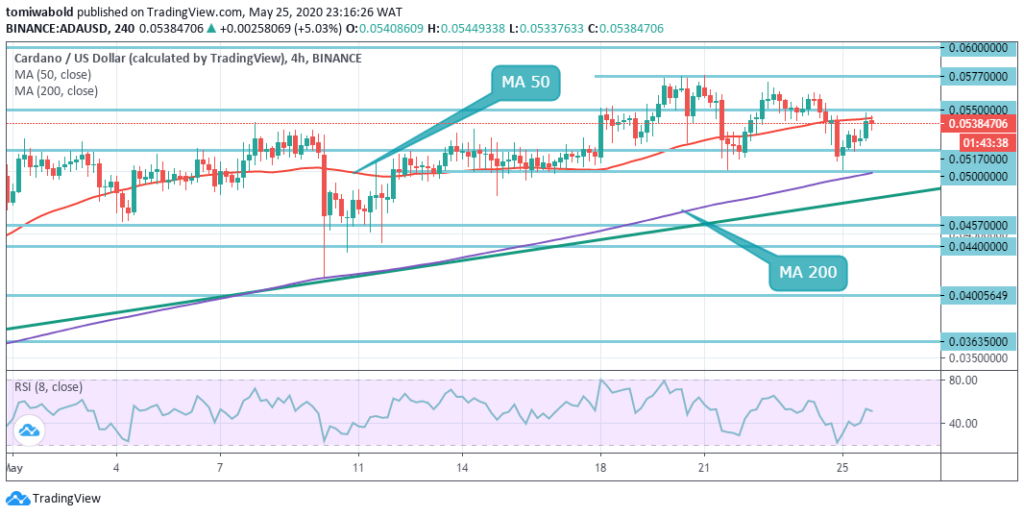 ADA/USD 4-Hour Chart
On the flip side as seen on the 4-hour time frame, ADA may probably stay bullish when the ascending trendline proceeds as market support. Inversely, if the price collapses beneath this trend line, a sustainable adjustment may be anticipated. A decline may validate a reversal to the price region of $0.0440-$ 0.0400. The volume of trading on the 4-hour chart also slightly reduces, indicating potential sideways trading.
While this chart has already provided a steady price range, the trend is still steadily upward. On the negative side, $0.0500 may prevent the reversals as it is also bolstered by 4-hour MA 200, but if Cardano retains its upward traction, it would need to exceed near-term resistance at $0.0577 before validating a strong bullish pressure to the resistance of $0.0600 and $0.0675.
Note: Kryptomoney.com is not a financial advisor. Do your research before investing your funds in any financial asset or presented product or event. We are not responsible for your investing results
Image Credit: Shutterstock


Keep in mind that we may receive commissions when you click our links and make purchases. However, this does not impact our reviews and comparisons. We try our best to keep things fair and balanced, in order to help you make the best choice for you.
