Most digital assets are trading lower in the cryptocurrency market on Monday. Cardano (ADA) declined to lows of $1.36 during Monday’s trading before slightly recovering to where it trades. At the time of writing, ADA was exchanging hands at $1.42, down by 2.85% on the day. With a present market valuation of $45.51 billion, Cardano has secured the 5th spot in cryptocurrency ranking by market cap. Despite the dip, ADA holds in the upside tendency it started after the bounce off the MA 200 ($0.98) on June 22 and more increases could come if there is a break of the upper part of the recent range at the MA 50 ($1.51). Grayscale Investments has reduced Bitcoin’s share and added Cardano to its Digital Large Cap Fund. With the introduction of Cardano, ADA now accounts for 4.26%, making it the fund’s third-largest after BTC and ETH.
Key Levels
Resistance Levels: $2.51, $2.03, $1.50
Support Levels: $1.20, $1.00, $0.79
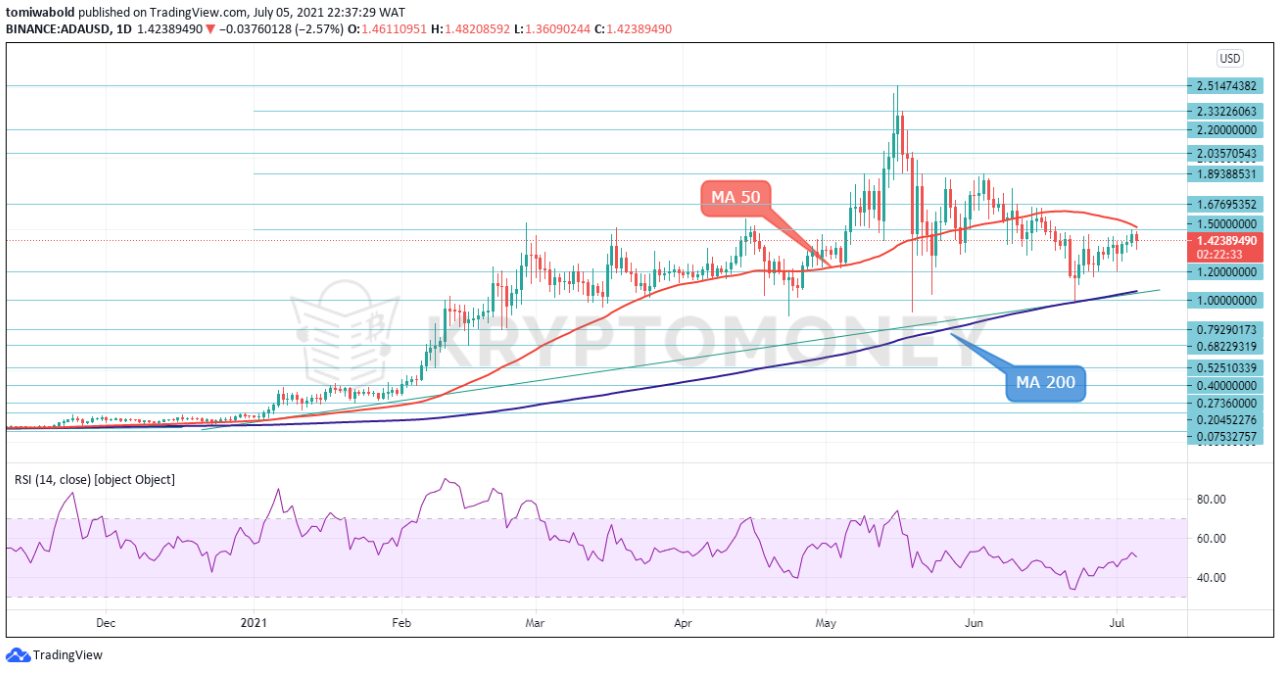 ADA/USD Daily Chart
ADA is edging slightly lower after reaching highs of $1.49 on July 4 but still holds the upside tendency started on June 22. ADA/USD is trading in a minor ascending trendline pattern. However, it was spotted on Monday that around the $1.48 level was providing the price with resistance. If the ascending trend line pattern holds, bullish traders might pressure the ADA/USD pair higher within the next sessions. In this scenario, ADA could reach the resistance range between $1.48-$1.53 (MA 50).
A bullish breakout above the MA 50 ($1.53) will target the $1.89-$1.98 resistance range. A sustained breach past here gets ready for a retest of the all-time highs at $2.51. Alternatively, if the ADA/USD pair extends the pullback, immediate support could arise from the $1.20 level. Below this line, the $0.98 level which marks the reinforced support of the MA 200 and the minor trendline may come to aid. The RSI around the 50 neutral marks suggests possible consolidation.
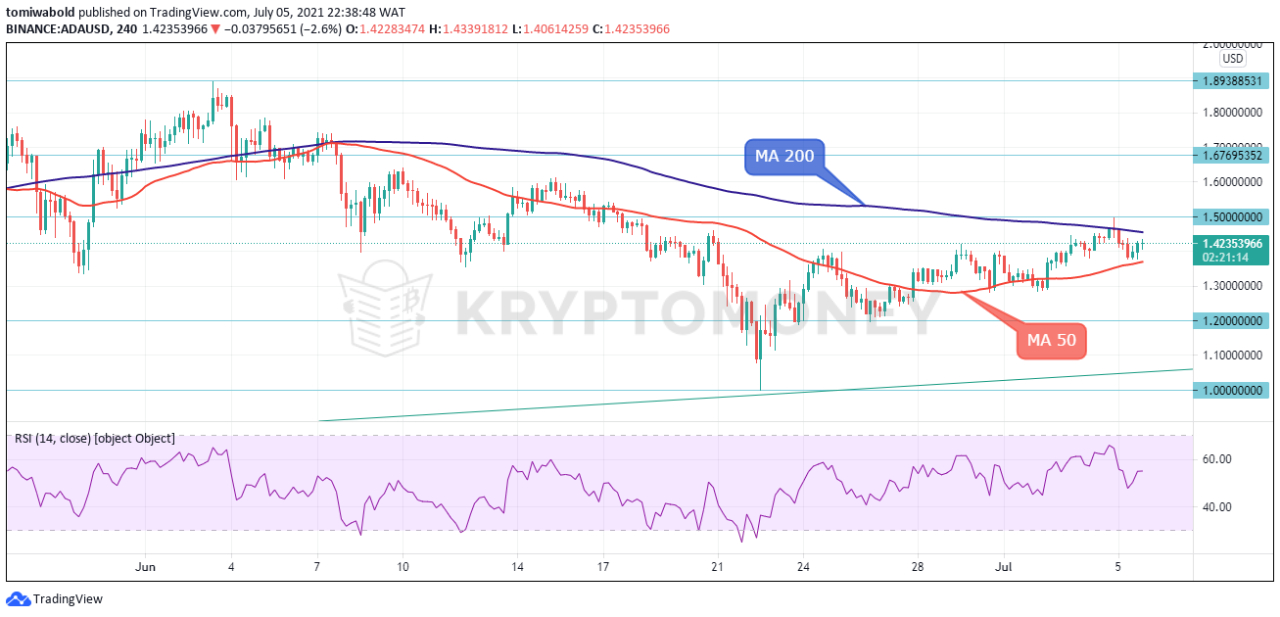 ADA/USD 4-Hour Chart
ADA rose to highs of $1.49 after a buying spike since June 22, surpassing the MA 50 ($1.36). ADA is returning lower after attempts to briefly pass the MA 200 at $1.45 failed. More negative pressures would send ADA/USD price to check the MA 50 support at $1.36. If traders continue to sell the pair, more declines could meet support at $1.19 before resting near the June 22 low at $0.98, which overlaps with the minor trendline support.
Alternatively, if the market reverses up, strong resistance, which lies near the MA 200 ($1.45) could come. If ADA price overcomes this critical level, the resistance levels at $1.54 and $1.89 could come into the spotlight. Higher still, ADA could hit the all-time highs at $2.51. To sum up, ADA remains in a neutral mode as seen from the RSI and a sustained climb above the moving averages could confirm a further bullish bias.
Note: Kryptomoney.com is not a financial advisor. Do your research before investing your funds in any financial asset or presented product or event. We are not responsible for your investing results
Image Credit: Shutterstock


Keep in mind that we may receive commissions when you click our links and make purchases. However, this does not impact our reviews and comparisons. We try our best to keep things fair and balanced, in order to help you make the best choice for you.