It is a green day on March 13th, 2021. Exactly a year ago, the crypto market crumbled to broad-based selling pressure. BTC sets new record highs above $60k, up from last year’s low of $3,800. After attaining new all-time highs of $1.546 on Feb. 27, Cardano (ADA) declines to the support of the $0.98 to $1.256 range. On Mar. 13, a rebound on ADA/USD ensues to intraday highs of $1.19 after bulls defended the support at $0.988 aggressively. At the time of writing, ADA is exchanging hands at $1.10, having gained 5.03% in the last 24 hours and 1.98% on a 7-day basis. With a market capitalization of $36.01 billion and $6 billion in trade volume over the past 24hrs, Cardano ranks fifth on the CoinMarketCap table. A recent survey by crypto broker Voyager Digital indicates retail investors more bullish on Cardano than BTC. The firm’s Digital Asset Investor Sentiment Survey reveals that 31.9% of polled investors are the “most bullish” on Cardano, while 22.2% chose BTC over ADA.
*Cardano (ADA) declines to the support of the $0.98 to $1.256 range
*ADA is exchanging hands at $1.10, having gained 5.03% in the last 24 hours and 1.98% on a 7-day basis
*31.9% of polled investors are the “most bullish” on Cardano
Key Levels
Resistance Levels: $1.6000, $1.4000, $1.2603
Support Levels: $1.0275, $0.8081, $0.6822
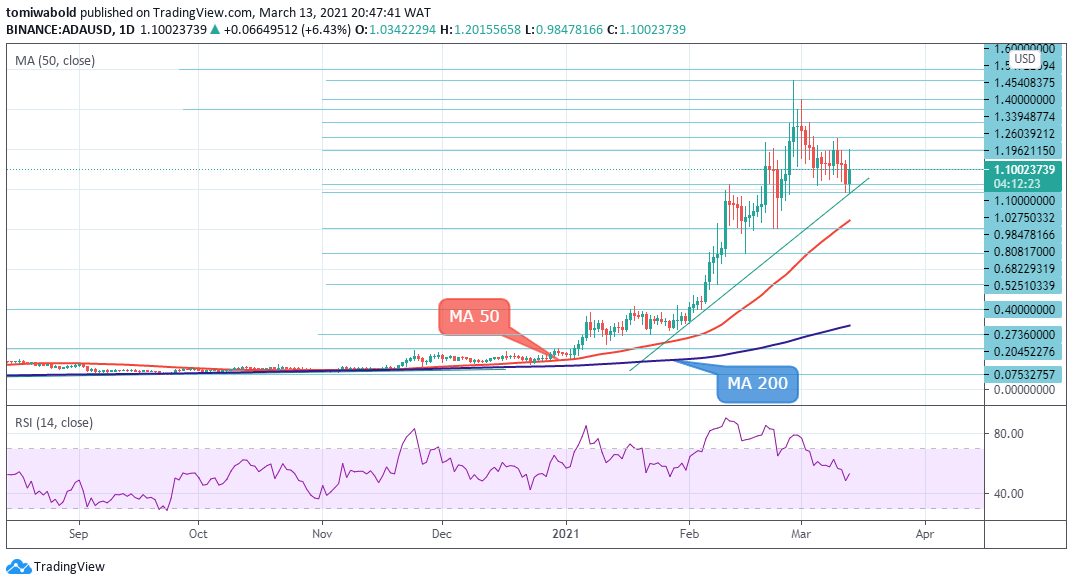 ADA/USD Daily Chart
As seen on the daily chart, Cardano remains in consolidation. A break above or below the range could start the next trending move. The RSI slightly above the midline suggests consolidation. If the price rises from the current levels and breaks above $1.26, it will suggest an advantage to the bulls.
That could result in a rally to $1.339 and then $1.454. The upsloping moving averages depict a bullish picture. On the other hand, if the advantage shifts in favor of the bears and price turn down from current levels, ADA may consolidate in the range for a few more days. A sustained break below the support at $0.98 could deepen the correction to the MA 50 at $0.846.
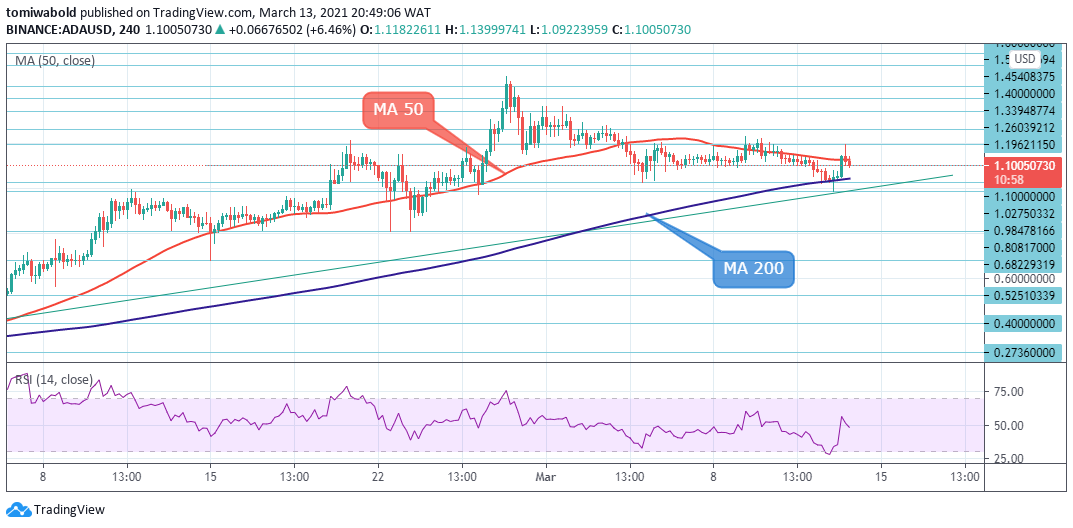 ADA/USD 4-Hour Chart
On the 4- hour chart, ADA presently trades at $1.10 as bulls battle the hurdle posed by the MA 50 at $1.127. A sustained break above the MA 50 could lift ADA price to as high as $2. The RSI just at midpoint suggests equal opportunities to the bulls and bears. On the other hand, If the MA 50 barrier remains strong, selling pressure may increase, leading to a correction.
On the downside, support is envisaged at $1.027 close to the MA 200. If this is broken, Cardano may revisit support at $0.98. If the correction deepens, ADA/USD may explore support at the $0.808 range. The ADA/USD pair stays bullish while trading above the $1.10 mark and MA 50 zone.
Note: Kryptomoney.com is not a financial advisor. Do your research before investing your funds in any financial asset or presented product or event. We are not responsible for your investing results
Image Credit: Shutterstock


Keep in mind that we may receive commissions when you click our links and make purchases. However, this does not impact our reviews and comparisons. We try our best to keep things fair and balanced, in order to help you make the best choice for you.