Cardano (ADA) joins the list of Altcoins benefiting from the recent rallies as bulls continue to hold the fort following widespread breakouts in the crypto market over the prior weekend. As price continues climbing, Cardano’s upside traction pulls ADA/USD past $0.11 indicating that the direction of the trend is upward. ADA/USD recovery momentum picked up pace recording 7 consecutive days of bullish run from $0.089 low to reach $0.1150 high today. Cardano is the 9th largest cryptocurrency by market capitalization, with $3.4 billion, and its 24 hours average trading volume is currently at $861 million. At present, ADA/USD now trades past 2 weeks high of $0.1075 registering a fresh high at $0.1150. ADA/USD is trading at $0.1095 at the time of writing. Cardano is outperforming the entire market, climbing above several key indicators and hinting at a long-term reversal. ADA HODLers average balance spikes 10% on September 3 from $5,000 up to $6,498, and still currently at $6,143. This metric indicates that more investors are willing to hold larger sums of ADA.
*Cardano’s upside traction pulls ADA/USD past $0.11 indicating that the direction of the trend is upward
*ADA/USD recovery momentum picked up pace recording 7 consecutive days of bullish run from $0.089 low to reach $0.1150 high today
*ADA HODLers average balance spikes 10% on September 3 from $5,000 up to $6,498, and still currently at $6,143
Key Levels
Resistance Levels: $0.1510, $0.1298, $0.1150
Support Levels: $0.100, $0.0850, $0.0750
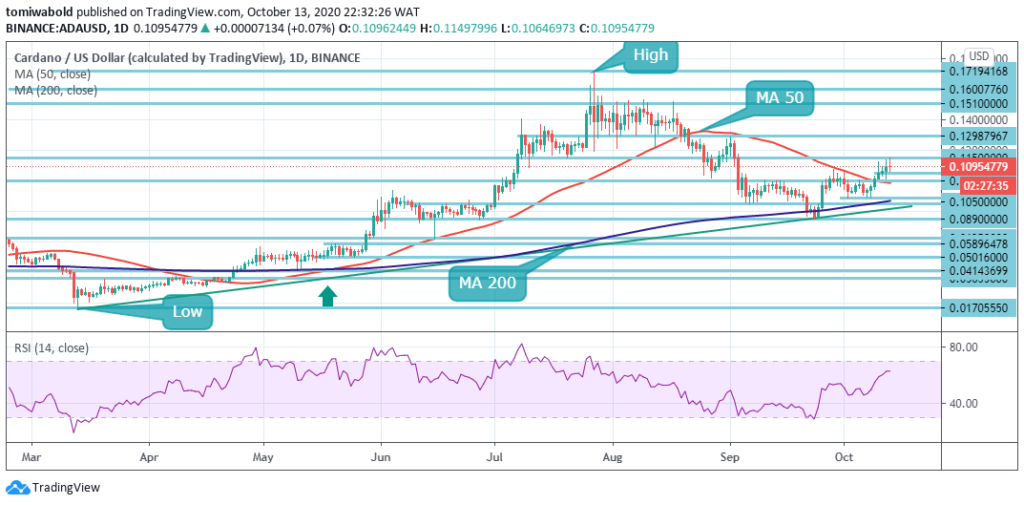 ADA/USD Daily Chart
The upward push gained pace after there was a breach beyond the MA 50 with the former resistance near $0.10 on the daily chart of the ADA/USD pair. There was also a breach beyond the 50 percent retracement level of the main decline from the $0.1298 high to $0.0753 low. Earlier today, Cardano was attempting to breach the resistance level of $0.1150.
An effective close beyond the level of $0.1150 may pave the way for a further advance toward the level of resistance of $0.1298. If a downside correction begins with Cardano’s price, it is capable of finding support near the $0.10 MA 50 region. At the $0.0850 mark, extra support on the downside is at the MA 200 zone. The price may begin a downward trend if there is a downside breach beneath $0.10.
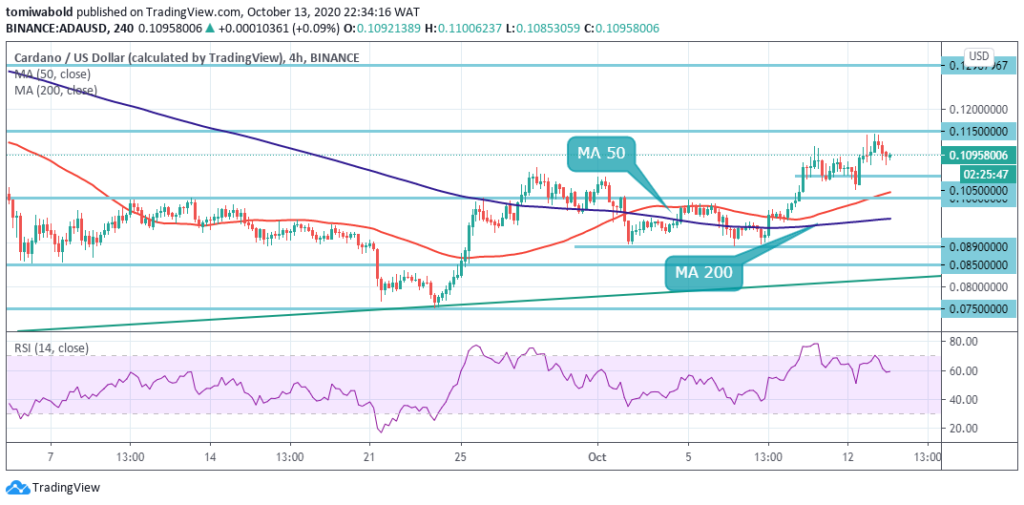 ADA/USD 4-Hour Chart
There’s a single obstacle in the direction of $0.1150 for Cardano bulls, as seen in the 4-hour time frame. The level which requires to be breached is $0.1150. The token would be pushed toward a $0.1298 level by a breakout. ADA/USD traders in the short and medium-term are inclined to buy into the price dip towards the $0.1050 technical support zone.
The lower time frame analysis reveals that inside a bullish dropping price channel, the ADA/USD pair is presently stuck. Although trading beyond the $0.1050 mark, the ADA/USD pair is only bullish; the main support is seen at the $0.1150 and $0.1298 levels. If the ADA/USD pair trades beneath $0.10, the $0.085 and $0.075 levels of support can be tested by sellers.
Note: Kryptomoney.com is not a financial advisor. Do your research before investing your funds in any financial asset or presented product or event. We are not responsible for your investing results
Image Credit: Shutterstock


Keep in mind that we may receive commissions when you click our links and make purchases. However, this does not impact our reviews and comparisons. We try our best to keep things fair and balanced, in order to help you make the best choice for you.
