
Cryptocurrency market holders have commenced monitoring days by the end of the year. It is assumed that the usual end of the year rally may lift crypto assets to levels higher. Bitcoin Cash, the seventh-largest cryptocurrency, undergone a hard fork on November 15th, 2020. Before the hard fork, prices of Bitcoin cash plummeted to as low as $242.78, down by 7.5% from an earlier high at $260.69. Following its decline came a bounce ahead of $240 as BCH/USD traction returns to positive territory post-Bitcoin Cash hard fork. The coin’s popularity as a direct competitor to Bitcoin has waned considerably but the Bitcoin Cash market cap still sits around $4.6 billion, with $2.86 Billion in exchange-traded volume over the past 24 hours. At the time of writing, BCH trades at $256 up from a recent low of $245. The fork is the third Bitcoin Cash fork, splitting the current chain into two parts: BCHN and BCH ABC. As per CoinMarketCap, most users are unlikely to be affected by the split and were told to watch out for further information.
*Before the hard fork, prices of Bitcoin cash plummeted to as low as $242.78, down by 7.5% from an earlier high at $260.69
*Following its decline came a bounce ahead of $240 as BCH/USD traction returns to positive territory post Bitcoin Cash hard fork
*The fork is the third Bitcoin Cash fork, splitting the current chain into two parts: BCHN and BCH ABC
Key Levels
Resistance Levels: $300, $280, $260
Support Levels: $245, $230, $215
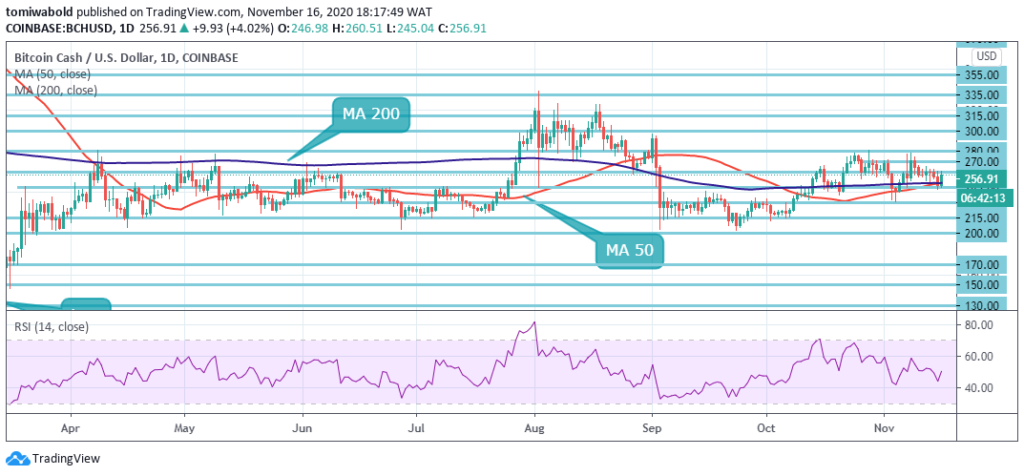 BCH/USD Daily Chart
BCH/USD has recovered from beneath the daily MA 50 and MA 200 following the hard fork induced sell-off. At the moment, Bitcoin Cash is holding above the key horizontal support zone at $245 and is poised for an extended rebound towards the $260 horizontal resistance zone. BCH/USD must close the day past its MA 50 and MA 200 to sustain the recovery. Otherwise, a breakdown to $230 and $215 support levels seems imminent.
BCH shows weakness in the near-term (as per its consolidation pattern) with only the medium-term trend still being bullish. As price trades close to resistance at $260, upside momentum could speed up to $300 should BCH mark new highs after its hard fork. The RSI forms a lower high pattern, while the price action is trending upward in a series of higher lows, as shown on the chart.
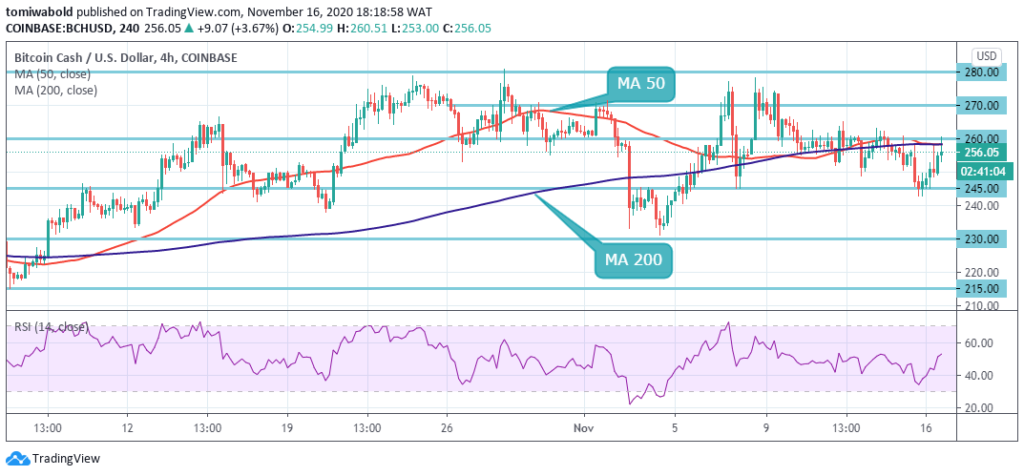 BCH/USD 4-Hour Chart
Technically speaking as seen on the 4-hour time frame, Bitcoin Cash price seems to be bounded between $230 and $280 for the past month. Currently, the short-term MA 50 and MA 200 are acting as resistance at $258 limiting the upward push. A breach from this zone may drive Bitcoin Cash price towards the horizontal resistance at $270.
The most vigorous resistance area is located between $260 and $270 and a reversal from this region may push Bitcoin Cash price lower to $245. On the other hand, splitting of the 4 hour MA 50 from MA 200 will allow for short-term consolidation below $260 which would be a notable bearish sign with two initial price targets of $230 and $215.
Note: Kryptomoney.com is not a financial advisor. Do your research before investing your funds in any financial asset or presented product or event. We are not responsible for your investing results
Image Credit: Shutterstock


Keep in mind that we may receive commissions when you click our links and make purchases. However, this does not impact our reviews and comparisons. We try our best to keep things fair and balanced, in order to help you make the best choice for you.