The digital currency market is witnessing increased volatility ahead of the upcoming US elections since it’s not obvious who the victor would be. Bitcoin Cash (BCH) bulls and bears had a struggle for market dominance, with the price flipping up and down. BCH/USD rallied to highs of $280.83 on Oct 28 without sustaining the advance. During the recent tussle, a lack of momentum to advance pushed BCH to a $252.98 low. Following a two-day decline, BCH/USD rebounds to hold past $260 in its bid to flip bullish. The BCH market cap is currently 5th on the Coinmarketcap table at $4.87 billion, with $2.09 Billion in exchange-traded volume over the past 24 hours. At the time of writing, BCH/USD is doddering slightly above $263 where it struggles to stay afloat. Slated for November 15, Bitcoin Cash hard fork nears with inside information revealing OKex will be among those to support the hard fork. The coins of the new chain will also be shared among BCH holders in a 1:1 ratio.
*BCH/USD rallied to highs of $280.83 on Oct 28 without sustaining the advance
*At the time of writing, BCH/USD is doddering slightly above $263 where it presently struggles to stay afloat
*Slated for November 15, Bitcoin Cash hard fork nears
Key Levels
Resistance Levels: $280, $260, $245
Support Levels: $230, $215, $200
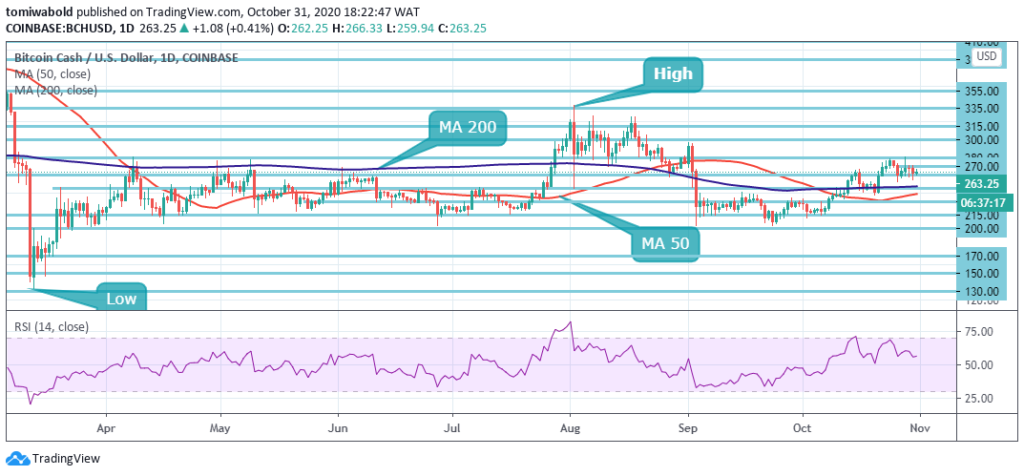 BCH/USD Daily Chart
As seen on the daily chart, Bitcoin Cash closed the previous two trading days in the negative territory as bulls and bears tussled for dominance. BCH has had a parabolic journey in the past weeks, as the price lifted off from early October lows of $212 to highs at $280, after which it suffered rejection on two counts. BCH has once again started increasing its value above the MA 200 but a strong resistance remains at $280. Breaking past this barrier should take BCH to the $300 zone.
On the other end, bulls managed to flip the $245 resistance level at the MA 200 into support. The next major support is near the $230 level. If the price fails to stay above the $245 support, the price could revisit the $230 support. Any further losses could lead the price towards the $200 handle.
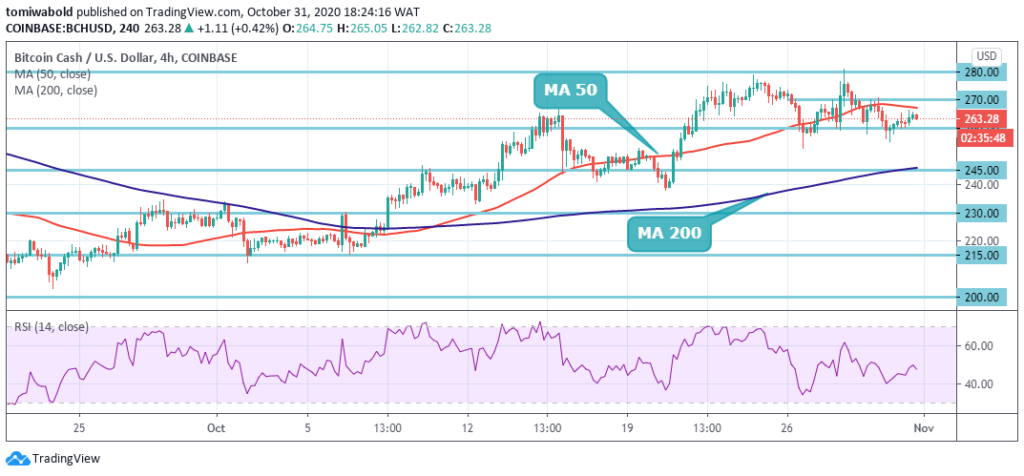 BCH/USD 4-Hour Chart
As seen on the 4-hour chart, BCH is depicting an optimistic outlook as price remains capped beneath the 4-hour MA 50. Bitcoin Cash had been struggling to stay afloat at the $260 level since October 26 as this made the $260 mark a strong level of support. However, strong resistance is seen at $270 as BCH struggled to breach above this key resistance.
Should we see a recovery above the 4 hour MA 50 then the BCH/USD pair could easily test back above the $270 resistance zone? The BCH/USD pair is only bullish while trading above the $245 level, key resistance is found at the $270 and the $280 levels. If the BCH/USD pair exchanges beneath the $245, sellers may test the $230 and $200 support levels.
Note: Kryptomoney.com is not a financial advisor. Do your research before investing your funds in any financial asset or presented product or event. We are not responsible for your investing results
Image Credit: Shutterstock


Keep in mind that we may receive commissions when you click our links and make purchases. However, this does not impact our reviews and comparisons. We try our best to keep things fair and balanced, in order to help you make the best choice for you.