Since the overall crypto market has bounced back from the recent downturn, this week the industry may have some tailwinds to ride. In 24 hours, the BCH trading volume is $3,377,575,600 and the market capitalization is up roughly at $4.45 billion with a positive shift of 1.20 percent in 24hrs. After recording major rallies in Bitcoin, Ripple, Ethereum among others, today’s emphasis is on Bitcoin Cash that has seen stability restored to its price. BCH/USD had bounced back to $245 for a triangular breakout. The price of the BCH coin has grown in the recent 5 days in an upward trajectory. As shown in the Crypto Fear & Greed Index, the mood of investors in the “extreme fear” region has risen to a healthy “fear” region which is a positive upgrade. The cashflow into Bitcoin and Altcoins is expected as many nations consider reopening their economies.
*BCH/USD had bounced back to $245 for a triangular breakout
*The price of the BCH coin has grown in the recent 5 days in an upward trajectory
*Crypto Fear & Greed Index, the mood of investors in the “extreme fear” region has risen to a healthy “fear” region
Key Levels
Resistance Levels: $325, $285, $250
Support Levels: $225, $200, $170
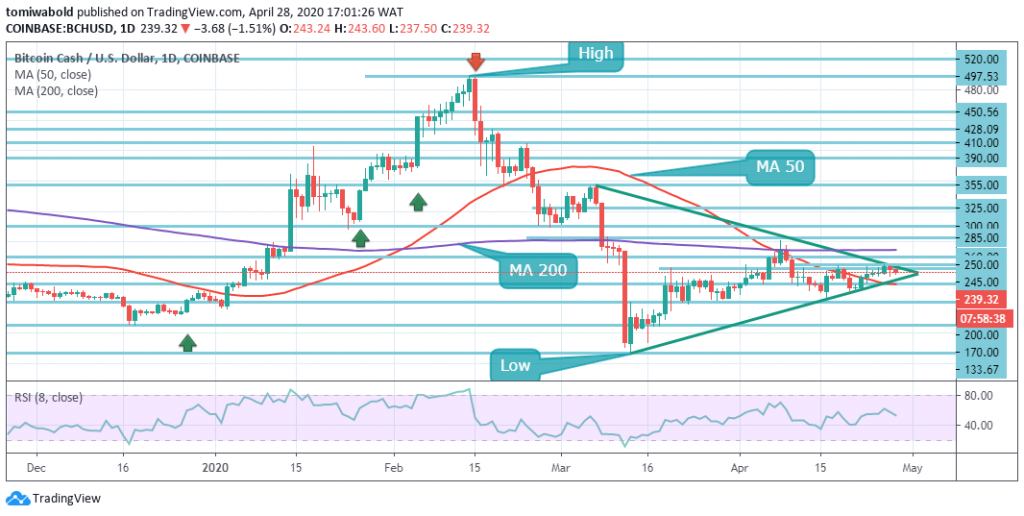
Bitcoin Cash trades at $240, after shifting from $243.60 (high intraday). The medium-term support is $225 and the resistance is $250 while the price stays within the range between MA 50 and MA 200. For the crypto-pair, both the daily MA 50 and the MA 200 form a confluence. The price has given nothing in position over the last weeks, shrinking to the downside within a range of $200 and to the upside around $260.
The described rallying scenario is supported from a technical standpoint by the triangular formation which holds within the territory of the consolidation. Furthermore, if the RSI remains at the mid-level of 50, buyers and sellers may be able to effect a reversal movement higher or lower $245. The daily resistance may be observed at $250, a break and exit beyond could be very motivating to improve the momentum on the positive side.
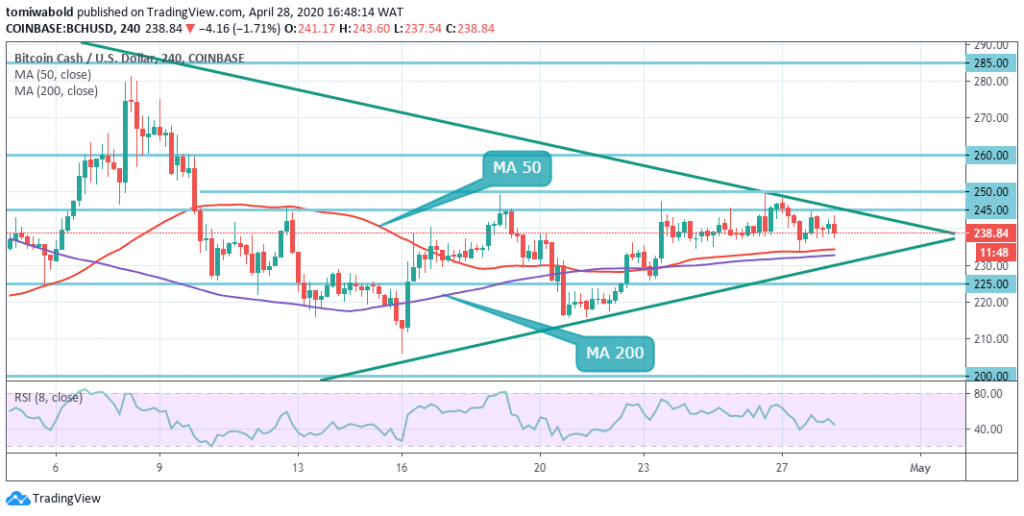
Over the last 5 days, BCH/USD has attempted to break over the near-term horizontal resistance of $250. This implies the bears’ intense defense of the resistance. The Altcoin is presently trying to retain the support available at the horizontally divergent 4-Hour 50 MA and 200 MA ($234 and $233, respectively).
There’s potential for the price to bounce back the decline seen in March, but it has to breach $250. If the BCH/USD pair drops beneath 50 MA and 200 MA, then the bears will instead attempt to push the price toward the $225 outside the triangle formation. If the bulls drive the pair past $245 and further, however, then $250 is more on the cards. The pending orders on the long positions can thus be activated at $260.
Note: Kryptomoney.com is not a financial advisor. Do your research before investing your funds in any financial asset or presented product or event. We are not responsible for your investing results
Image Credit: Shutterstock


Keep in mind that we may receive commissions when you click our links and make purchases. However, this does not impact our reviews and comparisons. We try our best to keep things fair and balanced, in order to help you make the best choice for you.
