
Bitcoin (BTC), the first and largest cryptocurrency by market cap is presently at one of the highest levels as seen in its monthly candle since the $20,000 highs.
Earlier in the week, Bitcoin in an explosive bull run surged past the pivotal $10,500 resistance to trade at the much-coveted $11,000. Bitcoin afterward spent the remaining part of the week consolidating at $11,000.
The significance of $10,500 is depicted as it marked the high of three different Bitcoin rallies in the previous year, indicating it is of utmost importance for bulls to hold.
After consolidating at $11,000, Bitcoin tested the year-to-date highs of $11,500 surging ahead to set a local high of $11,888 today after an influx of buying pressure.
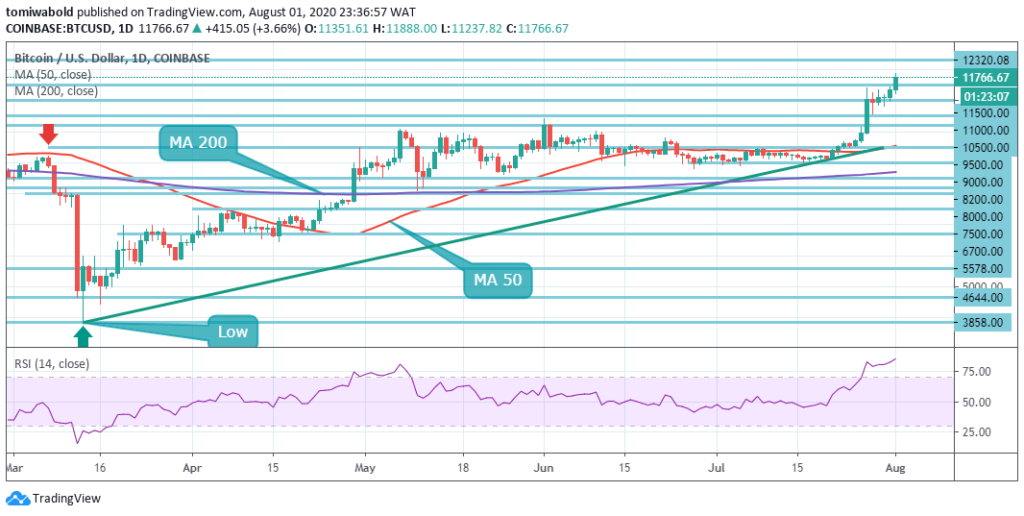 BTC/USD Daily Chart
At the time of writing, Bitcoin (BTC) is trading at $11,766, setting an intraday high of $11,888 gaining 4.05%.
1) Analysts say that Bitcoin surging past $11,500 raises the likely chances of it climbing higher in the weeks ahead: $11,500 is regarded as a historically important price point. This is because $11,500 was a pivotal macro level during early 2018 after Bitcoin hit its all-time highs of $20,000 in December 2017.
The significance of $11,500 to the long-term Bitcoin bull case was further stated by an analyst who studied a “structural fractal” which takes into account, factors that led up to Bitcoin’s previous bull runs. He noted that Bitcoin surging past $11,500 will lead up to major bull run.
Another trader stated that Bitcoin surging $11,500 may set the stage for Bitcoin retesting $20,000 all-time high.
Kelvin Koh of Spartan Group stated recently:
“If $BTC breaks the resistance at $11.4K, we are going above $12K in no time. Will take the wind out of Alts again the short term”.
This was further reinstated by other analysts who see a continuation of Bitcoin’s bullish momentum.
2) Volatility indicators remain at historical lows: despite Bitcoin’s massive price surge, macro volatility indicators remain at historically low levels. An analyst sees this as a potential for BTC to climb higher as ongoing volatility seems to be bull favoring.
3) On-chain data relating to BTC public sentiment indicates Bitcoin depicting bullish activity in short and mid-term trades while pointing to BTC being undervalued in this regard.
The TIE which provides data quantifying investor sentiments on digital assets indicated Bitcoin depicting bullish action in both short- and mid-term trades.
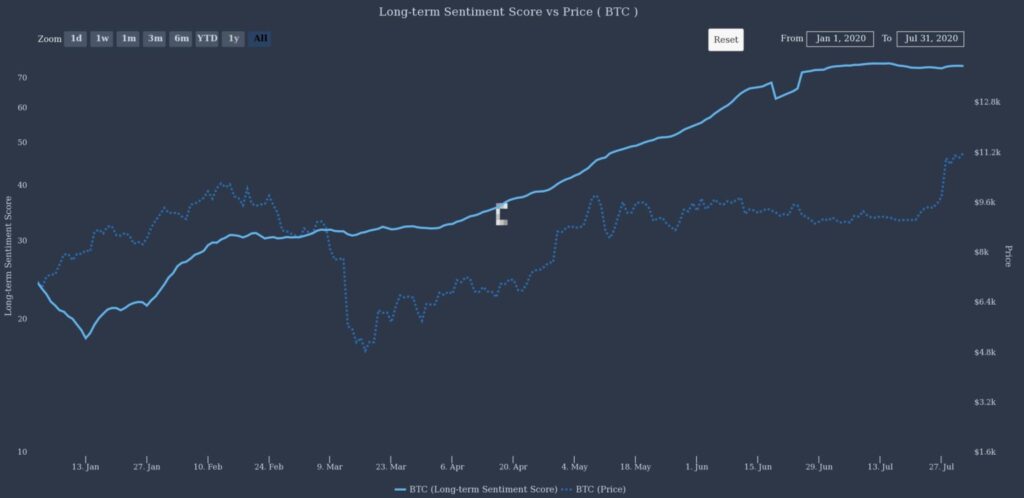
Comparing Bitcoin’s price with the “long-term sentiment score” indicated that BTC price has started matching up with the public perception of the top crypto asset.
Bitcoin sentiment held steady during the March market carnage, however, this has steadily grown with BTC price aspiring to match up.
However, Bitcoin price is still yet to fully match up leaving a “gap” indicating BTC is undervalued based on this. Twitter conversations have not yet entered ‘frenzy’ mode as tweet dominance stands at 42% amid the price surge.
4) On-chain data indicates BTC may first consolidate for a short period before it can begin its next true bull run in the latter part of this year. Bitcoin’s 365 days RSI indicates that BTC is still in the very early phases of its next bull trend. The analyst who postulated this sees an extension of Bitcoin’s bull trend into 2021 before losing strength.
Image Credit: The TIE, Shutterstock


Keep in mind that we may receive commissions when you click our links and make purchases. However, this does not impact our reviews and comparisons. We try our best to keep things fair and balanced, in order to help you make the best choice for you.