
The first and largest cryptocurrency by market cap, Bitcoin (BTC) extended its upward move past $19,400 on December 13. Bitcoin bulls rose to the occasion after a decline to lows of $17,580 on Friday.
Bitcoin’s new rally is spurring up questions; a fakeout or breakout? will this new Bitcoin rally lead up to the all-time high? will Bitcoin pay homage to history this time around?
Guy Hirsch of the eToro exchange recently stated that historically Bitcoin always posted a strong performance in December, thus he expects buyers to accumulate BTC during major dips. When Bitcoin faced immense selling pressure in the prior week, Denis Vinokurov of BeQuant stated that BTC’s downside is limited in the short term, expecting stability to recover while the outlook for December remains bright.
Some market participants believe that there is now reduced selling pressure in the near term following Miners and Whales’ massive sell-off in the prior week. At this juncture, the main key to Bitcoin reaching a new all-time high to subsequently enter a price discovery is the lack or less of selling pressure.
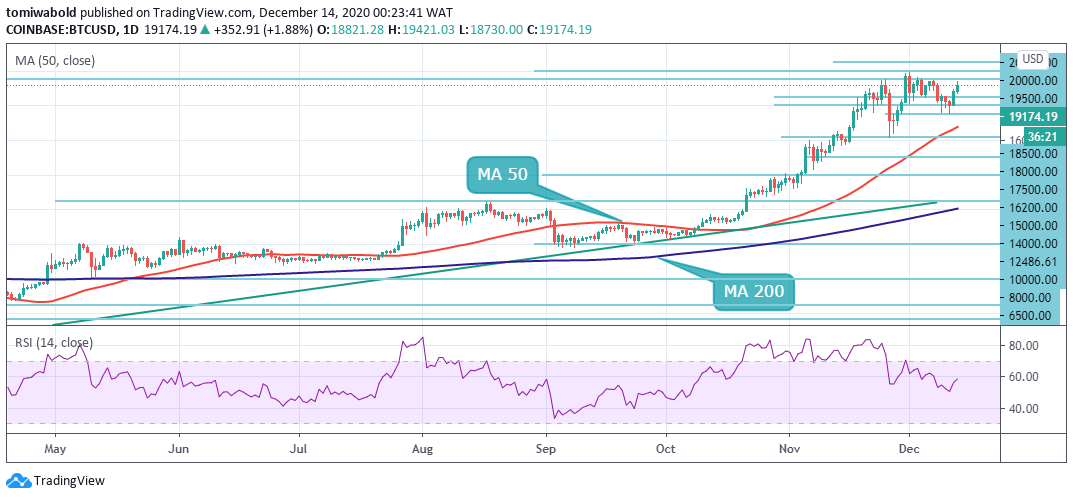 BTC/USD Daily Chart
Bitcoin presently trades at $19,174, up by 2% on the day, setting highs of $19,421.
A trader with the moniker “Beastlorion” indicated that the absence of sell pressure may trigger a big rally in the near term, stating:
“The price action on $BTC right now is something else. There’s like 0 sell pressure. It feels like the price is getting pulled up at this point instead of pushing up. Just look at those volume bars. Big pump coming IMO.”
First, some analysts believe Bitcoin bottomed in the near term at $17,600 following a significant increase in buyer demand at this level. This was substantiated by on-chain analysts who saw large buy orders on Bitfinex and Coinbase. Other technical analysts believe $17,000 may be the logical Bitcoin bottom as It marked the top of a weekly candle in January 2018, and it is also a major support area on lower time frame charts.
Second, it was also noted that the Bitcoin price started rallying after it breached past $18,800, which was identified as a potential whale cluster area and key resistance level.
Two Trends Were Further Seen: When Bitcoin rebounded from $17,600, it printed a higher low pattern on its 4-hour chart. This implies that the bottom of the recent correction is higher than the previous bottom. An analyst noted that this trend is often spotted during rallies. Based on this, some traders anticipate a breakout.
Michael van de Poppe of Amsterdam stock exchange noted that during Bitcoin’s large moves, a range is often built as markets need to gather strength to further such moves. There are also retests of previous resistance levels in this kind of scenario.
He noted that a rising wedge was formed with a fake breakout above its recent high in every of the prior range constructions. Further stating that the likely chances of a fakeout again is increasing based on the premise that this recent rally was backed with relatively low-volume as it occurred on a weekend. If there is no resistance flip, this new rally may end up being a fake-out.
According to him, Bitcoin may see either of these two scenarios in the near term- an upside move towards $21,000 if the $19,500 resistance area was flipped into support. Second, Bitcoin may fall back into the range. There are also two open CME gaps from recent price action. The first at $17,015 and the second one at $18,115 will be created after this recent BTC rally.
Image Credit: Shutterstock


Keep in mind that we may receive commissions when you click our links and make purchases. However, this does not impact our reviews and comparisons. We try our best to keep things fair and balanced, in order to help you make the best choice for you.
