
Bitcoin (BTC) price over the last few weeks was corrected lower below $4,000. The BTC/USD pair started plummeting and broke the $3,950 and $3,900 support levels. However, the pair have remained stable over the weekend and avoided a sell-off on Monday 25, with a slight drop on Tuesday 26 when prices consolidated around the $3,900 levels.
Today, Wednesday 27, the flagship cryptocurrency rallied again. At the time of writing, Bitcoin price traded at $4,008.58 as of 3:30 UTC, up 2.4%. This can be considered a rather robust gain for the relatively low volatility in the past months.
BTCUSD is still bearish considering the medium-term outlook as the pair has consolidated for straight four days, from March 21 to March 25. Eventually, BTC Bears gained momentum overpowered the Bulls resulting in a breakout towards the south with the formation of bearish candles that broke down the former demand level of $4,050. Thus, the price of Bitcoin fell towards the demand level of $3,903.
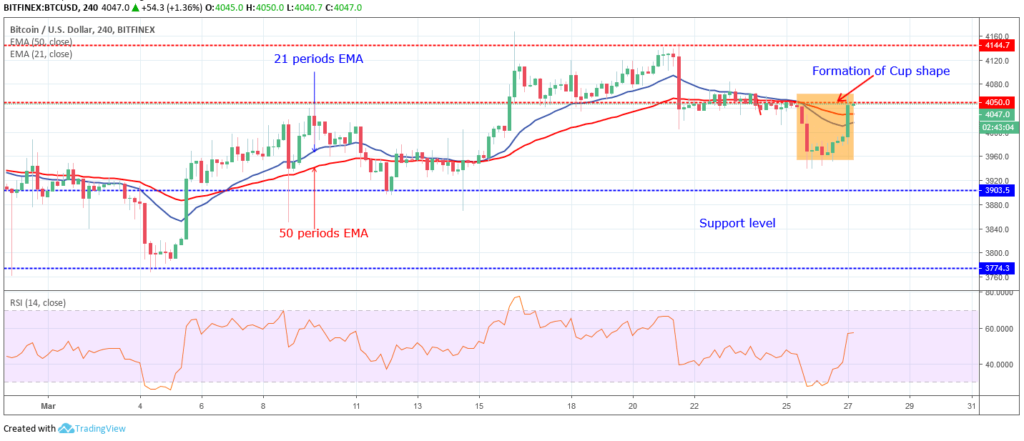
Bitcoin price was supported at the $3,903 zone while the Doji candle formed which was followed by a bullish candle which pushed BTC price upward towards the supply level of $4,050 to create a cup shape pattern.
Bitcoin Bulls has pushed up the price across the 21 periods Exponential Moving Averages (EMA) as well as the 50 periods EMA with the two EMAs bending upside. This is an indication of a bullish pressure in the BTC/USD pair.
Meanwhile, the Relative Strength Index (RSI) is at 60 levels with the signal line pointing upward, indicating a buy signal. However, if the Bulls are able to penetrate the $4,050 supply level to the upside and the bullish candle close above the said level, then, the next target supply level will be $4,144. If the $4,050 level holds, the bearish trend may continue.
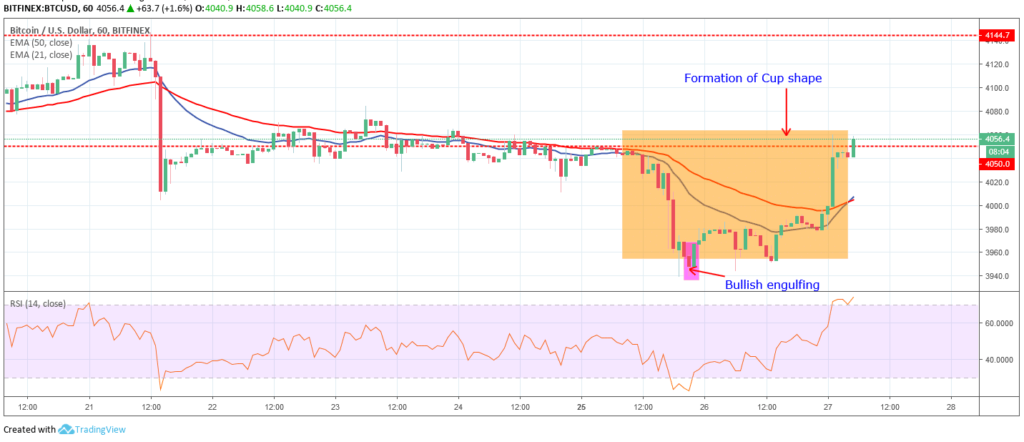
As the chart shows, the BTCUSD pair is bullish on the short-term outlook. The consolidation scenario ended on March 25 when the Bears dragged the price down to the $4,050 level and even towards $3,903.
BTC/USD is now trading above the 21 periods EMA as well as the 50 periods EMA with the former attempting to cross the later upside to confirm the bullish movement. moreover, the RSI is at 70 levels with a signal line pointing upward, indicating further upward movement in Bitcoin price.
Resistance levels: $4,050, $4,144, $4,254
Support levels: $3,903, $3,774, $3,637


Keep in mind that we may receive commissions when you click our links and make purchases. However, this does not impact our reviews and comparisons. We try our best to keep things fair and balanced, in order to help you make the best choice for you.
