
In this Bitcoin price analysis, BTCUSD will rise to retest the $6,100 price level if the 0.382(38.2%) retracement level holds. What is next?
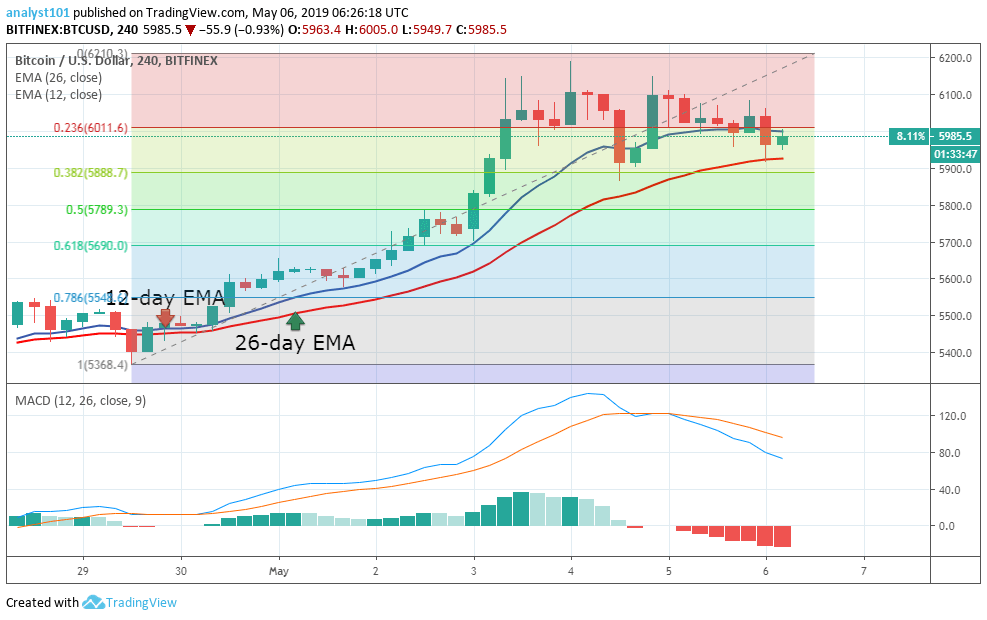
Bitcoin (BTC) price was in a bullish trend zone last week as it appreciated from $5,600 to $6,100 price level. On May 4, the price of BTC surged and the candlestick wick tested a high of $6,200 but price closed at $6,100. On two occasions, the bulls tested the resistance level of $6,100 but they met resistance.
Bitcoin price dropped to the support of the 12-day Exponential Moving Average (EMA) but the bulls pulled back to retest the resistance level. The bulls made a second attempt to break the $6,100 resistance level, but again, they were resisted. As a result, Bitcoin price declined to the support of the 26-day EMA. Looking at the Fibonacci retracement tool, Bitcoin price dropped to the 0.382 (38.2%) retracement level. This suggests that the bullish trend is ongoing in the zone of the Fibonacci retracement levels.
On the other hand, if the said retracement level holds, the price of Bitcoin will climb to retest the price level of $6,1006. On the downside, if the 0.382(38.2%) retracement level is broken, the BTC price will plummet. In the meantime, the Moving Average Convergence Divergence (MACD) line and the signal line are above the zero line, indicating a buy signal. Moreover, the price of Bitcoin is above the 12-day and the 26-day EMAs which is an indication that price is in the bullish trend zone.
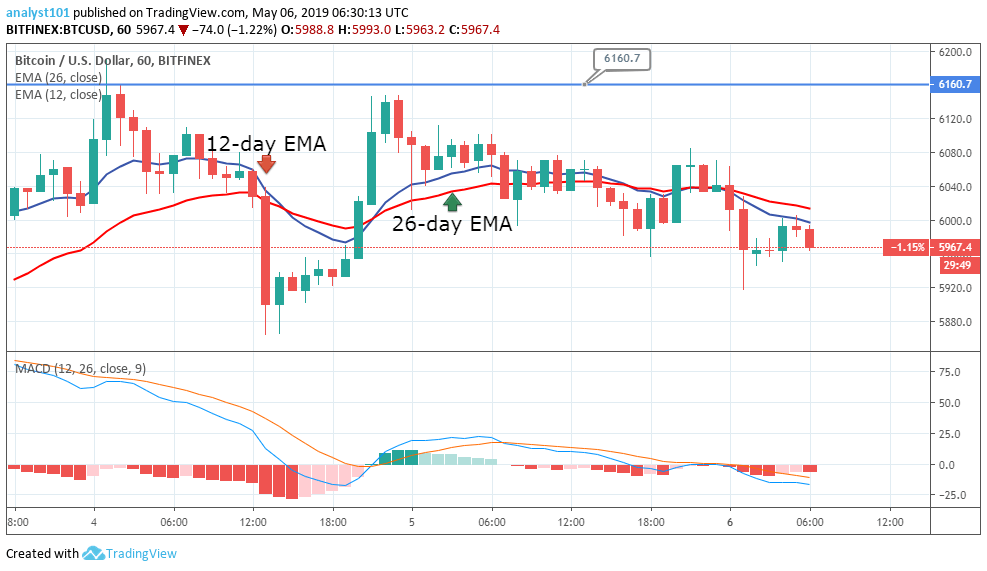
As the 1-hour chart shows, BTCUSD price is in a bearish trend zone as the bulls were resisted while attempting to break the $6,160 resistance level. On the two each occasion, the bears broke the 12-day and the 26-day EMAs to the bearish trend zone. In the first instance, the price dropped to a low at $5, 899.90 to resume another bullish trend.
In the second instance, BTCUSD dropped below the EMAs, the price was trading at $5,967 as at the time of writing. The MACD line and the signal line are below the zero line, indicating a sell signal. Bitcoin price is below the 12-day \and the 26-day EMAs suggesting that price is in the bearish trend zone.
Arathur Stephen is not registered as an investment adviser with any federal or state regulatory agency. The Information above should not be construed as investment or trading advice and is not meant to be a solicitation or recommendation to buy, sell, or hold any cryptocurrencies. The information is solely provided for informational and educational purposes. Always seek the advice of a duly licensed professional before you make any investment.


Keep in mind that we may receive commissions when you click our links and make purchases. However, this does not impact our reviews and comparisons. We try our best to keep things fair and balanced, in order to help you make the best choice for you.
