
The entire cryptocurrency market is in the red except for a handful of Altcoins such as Binance Coin that has been strong enough to record on the day. BNB is up on the day to trade at $23.32 intraday high. The ongoing bullish reversal has pulled BNB/USD above the July 27 high exactly one month again. After its downside correction, Binance Coin returns flight on BNB/USD towards the $24 threshold. The token currently has a market cap of over $3.27 billion and is the 10th largest cryptographic asset. At the time of this post, BNB/USD is changing hands at $22.5. In spite of Altcoins’ market sell-off on Powell’s speech, Binance Coin (BNB) recorded gains while other Altcoins followed Bitcoin (BTC) slump today. The statement resonates tolerance for periods of higher inflation to make up for the periods of low inflation. The cryptocurrency community believes that FED’s inflationary policies will eventually become a big booster for cryptos as a store of value and a hedge against inflation.
*The ongoing bullish reversal has pulled BNB/USD above the July 27 high exactly one month again
*After its downside correction, Binance Coin return flight on BNB/USD towards the $24 threshold
*In spite of Altcoins market sell-off on Powell’s speech, Binance Coin (BNB) recorded gains
Key Levels
Resistance Levels: $26.00, $25.00, $24.00
Support levels: $21.50, $20.50, $19.05
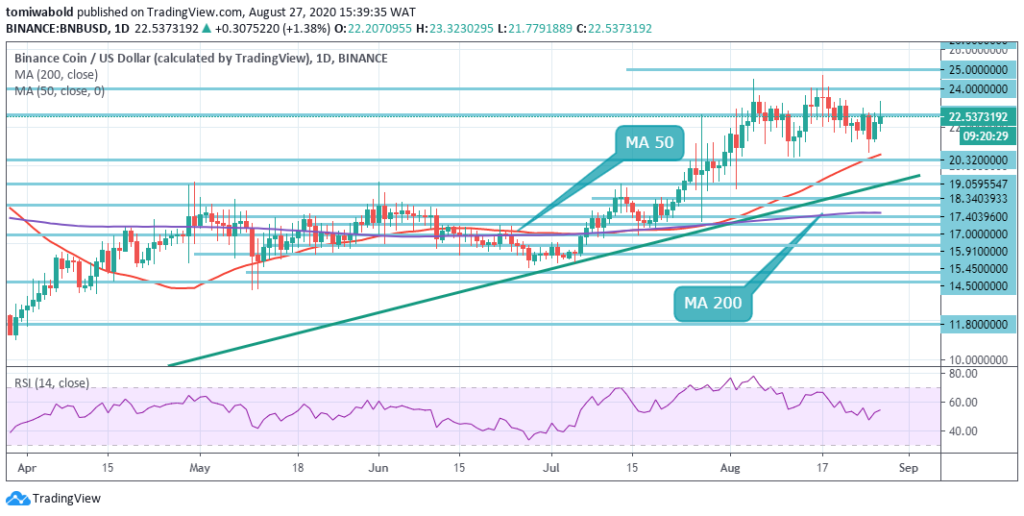 BNB/USD Daily Chart
On the daily chart, Binance Coin (BNB) is trading at a critical juncture over the medium term, following the bearish reversal towards the MA 50 zone at $20.50 level. Technical analysis shows that the BNB/USD pair may advance back towards the $24 level if the MA 50 continues to hold firm. To the downside, a breakout under the $20.50 support level could provoke a major sell-off towards the $19.05 level.
However, BNB has been bouncing off support region at $20.50, each bounce having a lower high than the last. Unless BNB forms a higher high, it could indicate the coin is primed for another slide in value to find support at $20.50 and beneath. BNB bulls have managed to obliterate the support levels and are eying up to $24 again. The daily chart is now in a robust uptrend and the only real resistance is established at $24 region.
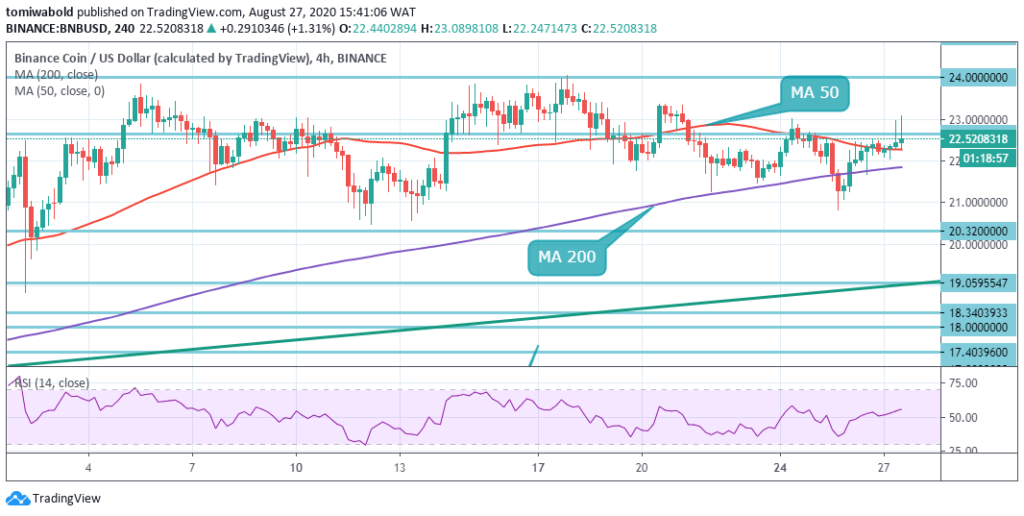 BNB/USD 4-Hour Chart
Binance Coin made gains in the past few hours and looked to have reclaimed the 4 hours MA 50 support level. BNB may manage to hold on to the stated support if buyers step in and the RSI does not dip beneath its midlines at 50 in the coming days, a reversal of short-term range trading to the upside is imminent.
On the contrary, a breakout under the 4 hours MA 50 may cause the BNB/USD pair to fall towards the $20.50 level, and possibly the $19.05 level. The BNB/USD pair is only bullish while trading above the $21.50 level, key resistance is found at the $24.00 and the $25.00 levels. If the BNB/USD pair trades below the $21.50, sellers may test the $20.50 and $19.05 support levels.
Note: Kryptomoney.com is not a financial advisor. Do your research before investing your funds in any financial asset or presented product or event. We are not responsible for your investing results
Image Credit: Shutterstock


Keep in mind that we may receive commissions when you click our links and make purchases. However, this does not impact our reviews and comparisons. We try our best to keep things fair and balanced, in order to help you make the best choice for you.