The BNB coin is a utility token inside the Binance ecosystem and the entire crypto sphere, with numerous utilization instances. The growth portfolio of BNB is powered by several variables and has achieved an impressive start to Q2 2020, making solid gains in a growing market for cryptocurrencies. It has built a spot on the Coinmarketcap table as the 11th top crypto-asset. BNB/USD has risen by 1.0 percent in the past 24 hours in an attempt to crack existing barriers beyond $18.0. The rebound is in tandem with other Altcoins as BNB/USD registers steady consolidation past $17.50. Recently Binance has withdrawn 477,388 BNB tokens (about $60.5 million) from circulation, reflecting the largest historic burn. The plan which seeks to decrease BNB’s supply and increase its value will see coins burnt each quarter before it effectively eliminates half (100 million) of the total supply.
*BNB/USD has risen by 1.0 percent in the past 24 hours in an attempt to crack existing barriers beyond $18.0
*The rebound is in tandem with other Altcoins as BNB/USD registers steady consolidation past $17.50
*Recently Binance has withdrawn 477,388 BNB tokens (about $60.5 million) from circulation, reflecting the largest historic burn.
Key Levels
Resistance Levels: $20.32, $19.05, $18.00
Support Levels: $17.43, $16.46, $15.45
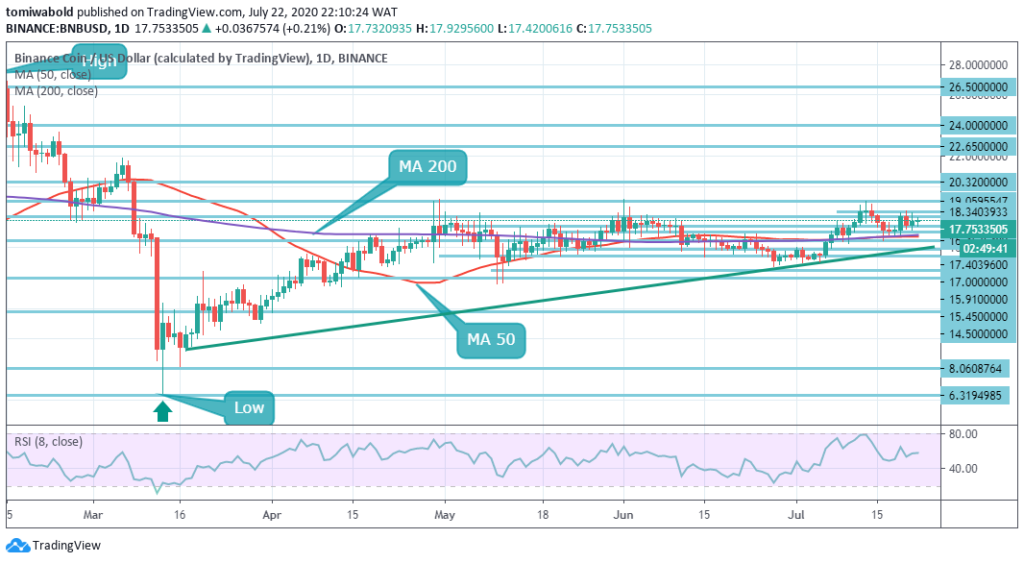 BNB/USD Daily Chart
BNB has stayed beyond the daily MA 50 and MA 200 and positioned at $17.75 while attempting to push beyond $18 till the next level of resistance at $19.05, the July 2020 high. BNB tends to be moving horizontally but has held for quite some time to stay beyond both MAs. The RSI hovers past 50 but ever so slightly.
BNB/USD had a noticeable sized-run which began only a few days later on July 6 from a low of $15.3 to a high of $19.05. BNB then had a phase of consolidation and was down to $16.5 before the bulls took over again. If losses increase from current levels, BNB may seek support in the region of MA 50 and MA 200 ($16.80) merger. On the positive side, breaking past $18.0 may motivate further bulls forcing a spike beyond July high at $19.05.
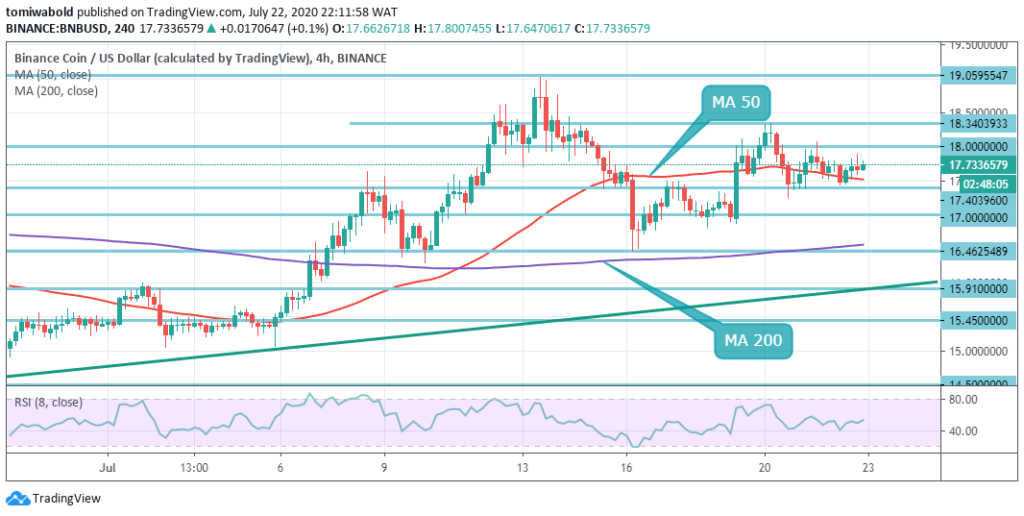 BNB/USD 4-Hour Chart
The MA 50 and MA 200 crossed bullishly on the BNB/USD 4 hour chart on July 11, with rates returning to the 4 hour MA 50 this week. Bullish trend confirmation normally begins once the MA 200 is validated as the support. Both volume and RSI do not give any indication of bearish or bullish divergences.
Substantial support for the volume (horizontal lines) is around $15-$17 and $14.50 levels. Horizontal resistance increases at $19.05 and beyond that level till it reaches $27.51 2020 all-time high. BNB may drive higher for the time being, as the coin consolidates beyond $17, a key level as per the volume profile.
Note: Kryptomoney.com is not a financial advisor. Do your research before investing your funds in any financial asset or presented product or event. We are not responsible for your investing results
Image Credit: Shutterstock


Keep in mind that we may receive commissions when you click our links and make purchases. However, this does not impact our reviews and comparisons. We try our best to keep things fair and balanced, in order to help you make the best choice for you.
