
Binance Coin (BNB) is the native digital token of the mega Binance crypto exchange. Binance BNB’s upside tends to lead and breaks from its range to fresh highs have been seen to usher Bitcoin’s price higher. Nonetheless, bulls ran out of steam on BNB/USD in its attempt to consolidate after hitting a fresh $34 high in the prior day before the tables turned. During today’s American session the coin fell under $30.00 to record a low at $27.21. Although BNB/USD remains higher than 25 percent weekly, the chart patterns are issuing warnings. The momentum from the bears may continue to gain traction. At present, the token has a market cap of more than $4.03 billion and is the 7th largest cryptocurrency asset. BNB is trading at $28.30 at the time of writing, following another decline from the recent intraday highs of $32.09. The Japanese cryptocurrency exchange Fisco filed a case on allegation of Binance $9M money laundering claiming its role in the Zaif hack theft in 2018. Fisco claims the hackers have succeeded in turning the stolen coins into other assets and cashing through Binance.
*During today’s American session the coin fell under $30.00 to record a low at $27.21
*Nonetheless, bulls ran out of steam on BNB/USD in its attempt to consolidate after hitting a fresh $34 high in the prior day before the tables turned
*The Japanese crypto-currency exchange Fisco filed a case on allegation of Binance $9M money laundering
Key Levels
Resistance Levels: $33.50, $32.09, $30.00
Support Levels: $27.00, $25.50, $23.00
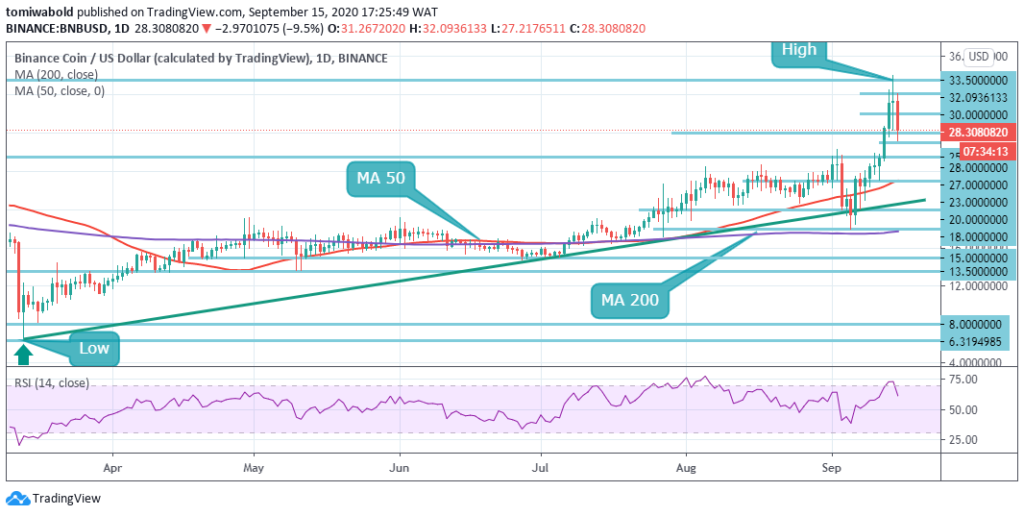 BNB/USD Daily Chart
BNB/USD has formed a gangly bearish candle pattern on the daily chart. If the bearish momentum is maintained by the end of the day, the pattern may get validated, and the sell-off could be prolonged to the next $25.00 bearish level, supported by ascending trendline support.
If the price swings to the lower line of the upside-looking channel at $28.00 a steady move beneath the horizontal support line may reinforce the bearish signal and enable the initial goal to shift downwards level at $25.50. Under here is the daily MA 50 support at $23.00 and a psychological $20.00 level.
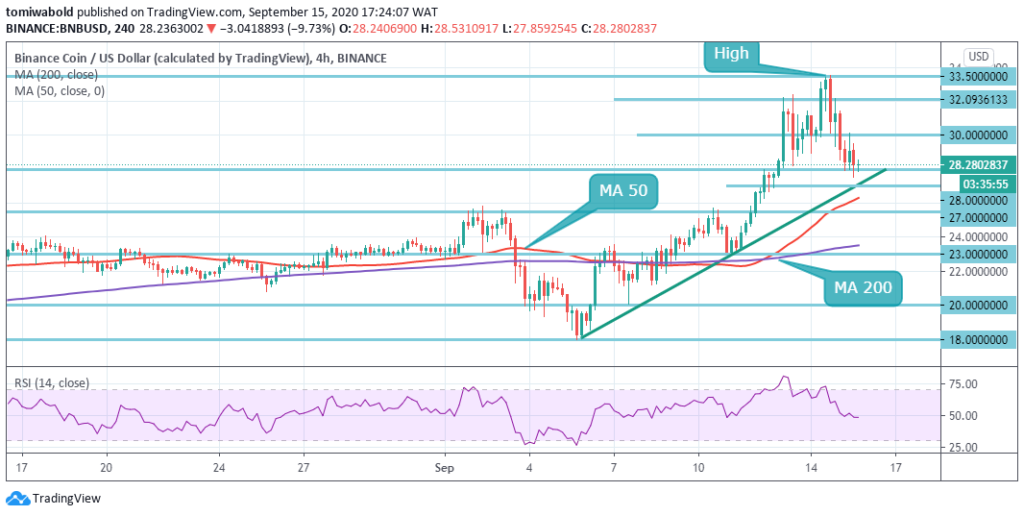 BNB/USD 4-Hour Chart
BNB/USD may rebound off the bullish trendline at $27.00 on the 4-hour chart. This barrier may hold back the sell-off as seen in the 4-hour time frame and trigger a rebound toward the psychological $30.00. But if it’s breached the downside acceleration may gain traction with the next emphasis on $25.50.
This barrier is given validity by the 4-hour MA 50 located underneath this zone. When it’s out of the path, the $25.50 aforementioned medium-term support may come into view. The BNB/USD pair is only bullish while exchanging beyond the level of $28.00, the main resistance is seen at levels of $30.00 and $32.09. Sellers may test the $27.00 and $25.50 levels if the BNB/USD pair exchanges underneath the $28.00 level.
Note: Kryptomoney.com is not a financial advisor. Do your research before investing your funds in any financial asset or presented product or event. We are not responsible for your investing results
Image Credit: Shutterstock


Keep in mind that we may receive commissions when you click our links and make purchases. However, this does not impact our reviews and comparisons. We try our best to keep things fair and balanced, in order to help you make the best choice for you.
