
Binance Coin (BNB) is the Binance exchange coin and as of 2019, several entities receive BNB as a payment method. BNB ‘s price has steadily increased since the ICO, with the exchange’s growth. By market cap, BNB is amongst the top 10 global cryptocurrencies. Although most investors keep close tabs on Bitcoin, as of recently, a few crypto-assets have recorded strong performances. Binance Coin Bulls are gaining traction after a weekend session that is associated with low activity and sideways trading. Price volatility stays weak on BNB/USD beneath $17.00 as the Altcoin continues to consolidate without offering any strong hint of where it’s heading soon. While the trend seems to shift towards Altcoins with limited capitalization, Binance Coin’s Social Sentiment Index stays neutral, such indecisiveness between price and volume is another indication suggesting a low volume of trading resulting in lower price volatility.
*Binance Coin Bulls are gaining traction after a weekend session that is associated with low activity and sideways trading
*Price volatility stays weak on BNB/USD beneath $17.00 as the Altcoin continues to consolidate without offering any strong hint of where it’s heading soon
*While the trend seems to shift towards Altcoins with limited capitalization, Binance Coin’s Social Sentiment Index stays neutral
Key Levels
Resistance Levels: $20.32, $18.8, $17.00
Support Levels: $15.45, $14.50, $14.00
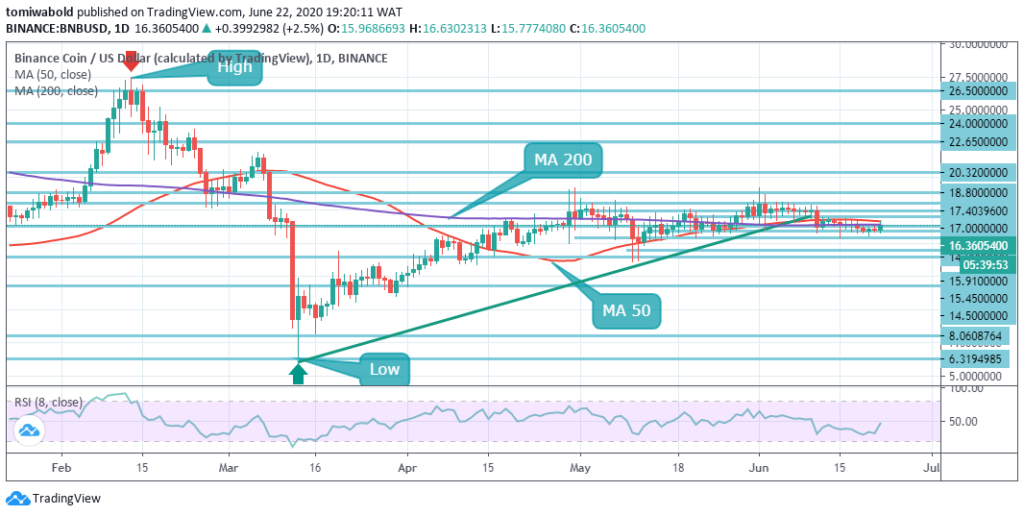 BNB/USD Daily Chart
Overall, the coin traded sideways, even though we’ve been seeing lower highs since last week. The cryptocurrency is witnessing a mini-bull trend past the $16.00 level since early Monday as is shown on the daily, BNB bounced back from the recent $15.45 lows set on June 15th when its price declined in tandem with the general crypto market.
There is presently a likelihood that BNB may propel higher, but the coin may need to consolidate beyond $17 initially – a key level as per the status of the volume. There isn’t much trading activity afterward until we’re at and beyond the $20.3 area, meaning there’s a better chance that BNB may break through those levels. At the time of this post, BNB/USD is trading at $16.36.
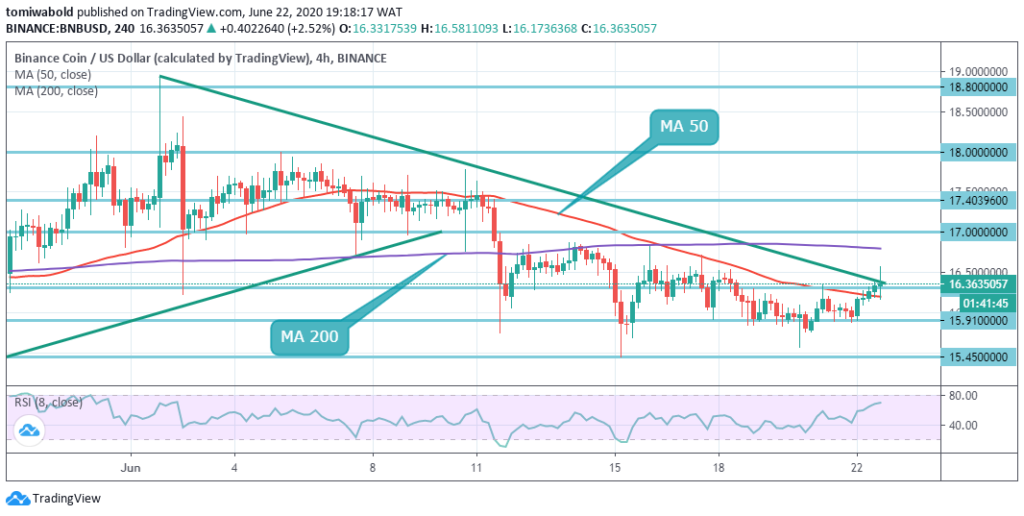 BNB/USD 4-Hour Chart
Looking at BNB/USD’s 4-hour chart, we see a bearish reaction to a short-term descending trendline with its apex from high at $18.92 on 1 June to its recent low at $15.45 which implies a short-term bearishness. 1 Meanwhile, BNB has pierced the lower end of the descending trendline in today’s trading and is inclined to swing the correction to the initial resistance level at $17 in the short term.
Besides, the RSI indicates that on the 4-hour time frame, the crypto is not yet overbought, allowing space for more upside move before it is primed for a reversal. It’s also vital that the price stays beyond $17 to prevent dips beneath the recent $15.45 lows. If the recent 15th June scenario is repeated, Binance Coin may be primed for a bearish impulse.
Note: Kryptomoney.com is not a financial advisor. Do your research before investing your funds in any financial asset or presented product or event. We are not responsible for your investing results
Image Credit: Shutterstock


Keep in mind that we may receive commissions when you click our links and make purchases. However, this does not impact our reviews and comparisons. We try our best to keep things fair and balanced, in order to help you make the best choice for you.