
The entire cryptocurrency market is regaining lost ground and one of the biggest gainers is Binance Coin (BNB) with a 16.68% increase in 7 days. The token saw massive gains propel its price past key levels while outperforming major coins like BTC and ETH. Recently BNB had exploded from an average price of $20 to a peak of $33.54. After its correction to the low at $22, upside gains increase upon BNB/USD 6 days bull run past $28. The market cap currently stands at $4.09 billion with more than $603 million in trade volume in the past 24 hours. The crypto asset is ranked 6th on the Coinmarketcap table, above Polkadot (DOT) and beneath Bitcoin Cash (BCH). Binance Coin (BNB) is currently trading at around $28.22 following a minor retracement from $28.83 intraday high on Tuesday. Binance delves into DeFi with Binance Smart Chain as CEO Changpeng “CZ” Zhao sees prospects in DeFi. The Binance CEO recently acknowledged that the nascent DeFi sector could eventually upend the business that Binance has grown to dominate: running a centralized cryptocurrency exchange.
*Recently BNB had exploded from an average price of $20 to a peak of $33.54
*After its correction to the low at $22, upside gains increase upon BNB/USD 6 days bull run past $28
*Binance delves into DeFi with Binance Smart Chain as CEO Changpeng “CZ” Zhao sees prospects in DeFi
Key Levels
Resistance Levels: $33.54, $32.09, $30.00
Support Levels: $27.00, $25.50, $23.00
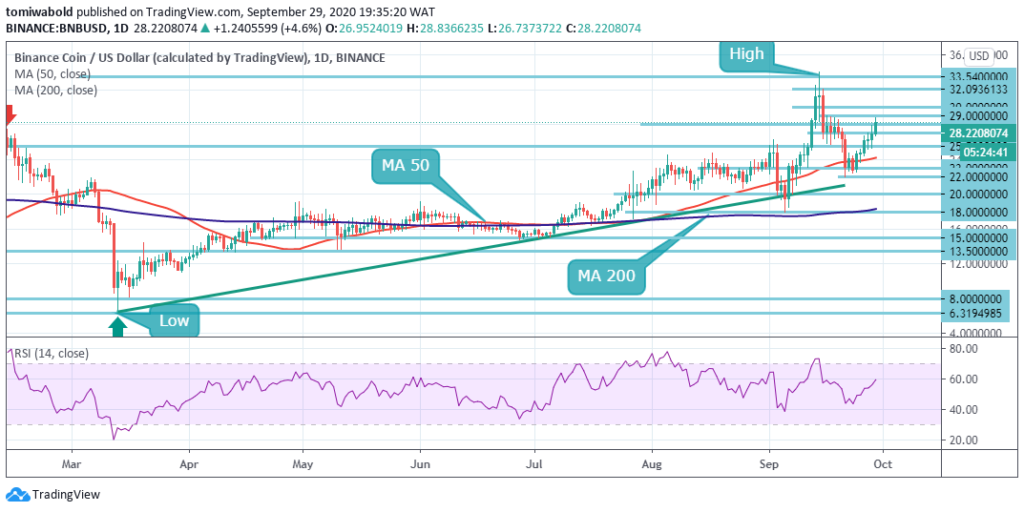 BNB/USD Daily Chart
After the last major correction that took BNB price down from $33.54 to $22. BNB/USD bulls were able to push the price back up to a current high of $28.83 after 6 consecutive days of bullish run, climbing past the daily MA 50. The RSI is getting closer to overbought levels although with more room for further increase.
However, a retest of the upside channel around $30 may create a bearish opportunity for sellers and the price is likely to see a rapid decline in the near-term. The rally to yearly highs at $34 didn’t last for too long. The reduction in momentum is suggesting a lack of new entrants to the BNB/USD bull market and may revamp the bearish case again.
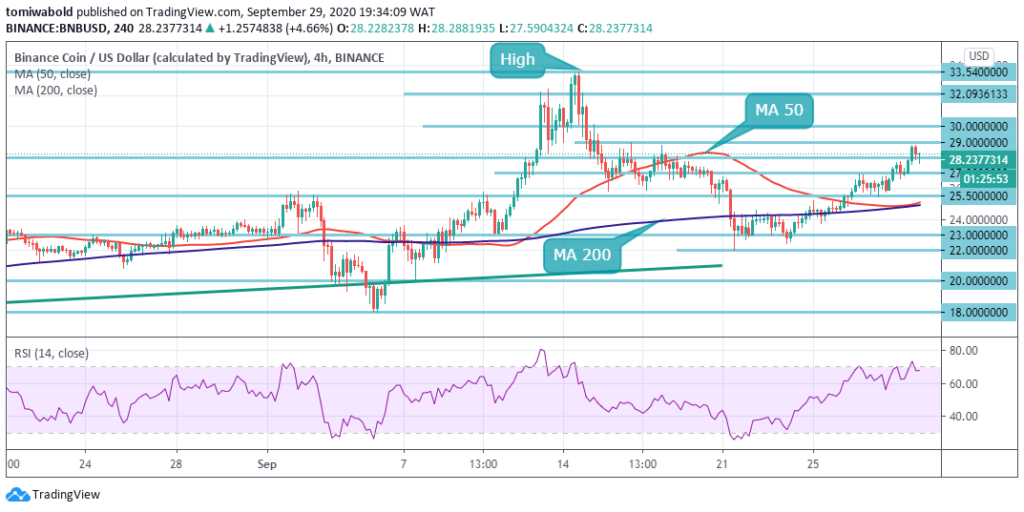 BNB/USD 4-Hour Chart
Binance Coin is starting to appear more of a consolidation in the near-term after the cryptocurrency recently found strong technical support from the $22 area. BNB/USD bulls could now challenge the $30 area if they can move price above the $29 level. A bullish pattern on the lower time frames is also projecting a potential move towards the $33.54 technical area.
Traders that are bullish towards the BNB/USD pair may buy around current levels in expectation of a rally towards the $30 level. BNB/USD bulls may sell the pair around current levels in expectation of a coming decline towards the alignment zone of the 4 hour MA 50 and MA 200 before the eventual push from its demand area.
Note: Kryptomoney.com is not a financial advisor. Do your research before investing your funds in any financial asset or presented product or event. We are not responsible for your investing results
Image Credit: Shutterstock


Keep in mind that we may receive commissions when you click our links and make purchases. However, this does not impact our reviews and comparisons. We try our best to keep things fair and balanced, in order to help you make the best choice for you.