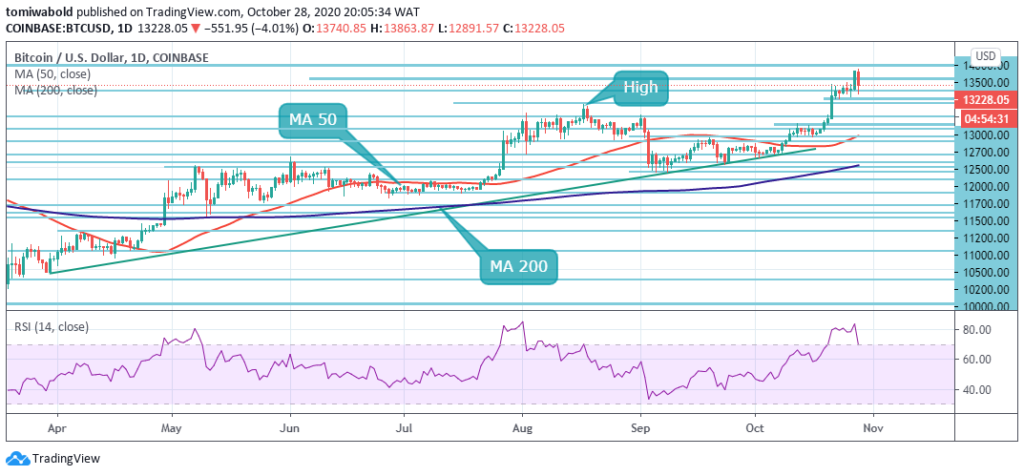
The leading cryptocurrency Bitcoin (BTC) hit fresh yearly highs on Tuesday, reinforcing the projection of a rally to $14,000. The surge tagged along with key cryptocurrencies higher, including Ethereum and Ripple. Albeit the price got rejected around $13,863 as Bitcoin bulls take a breather from the impressive rally to new yearly highs. After a $14k attempt, BTC/USD price clusters support around $13k as buyers rush to hold the ground above low levels. The Bitcoin (BTC) market cap is currently $244.21 billion, with $37.44 billion traded in the past 24 hours. The current spot price is down 3.04% from the all-time high established on the 26th of October 2020. The price registered a low at $12,891 and has retraced higher to trade at $13,228 as of when composing. On-chain analysis firm, Glassnode in a recent update indicated that there are presently 20k Bitcoin addresses holding more than $1million worth of BTC. It noted that this is the highest number seen since January 2018.
*Albeit the price got rejected around $13,863 as Bitcoin bulls take a breather from the impressive rally to new yearly highs
*After a $14k attempt, BTC/USD price clusters support around $13k as buyers rush to hold the ground above low levels
*On-chain analysis firm, Glassnode in a recent update indicated that there are presently 20k Bitcoin addresses holding more than $1million worth of BTC
Key Levels
Resistance Levels: $14,500, $14,000, $13,500
Support Levels: $13,000, $12,500, $12,000
 BTC/USD Daily Chart
BTC/USD is consolidating beyond $13,000 after trading down from today’s high of $13,863. However, BTC may resume the recovery after a short-lived correction as the selling pressure will contend with a cluster of support around the $13,000 and buyers confluence zone. This area serves as a demand zone before the lift-off to $13,863.
A daily close over $13,250 may signify the end of the Bitcoin consolidation phase and the start of a new bullish cycle, from a technical perspective. If this prior resistance is validated as support, on the path to $14,000, there may be nothing to deter BTC. A price correction back beneath the $13,000 support area may present such an opportunity for short term sellers in the coming days.
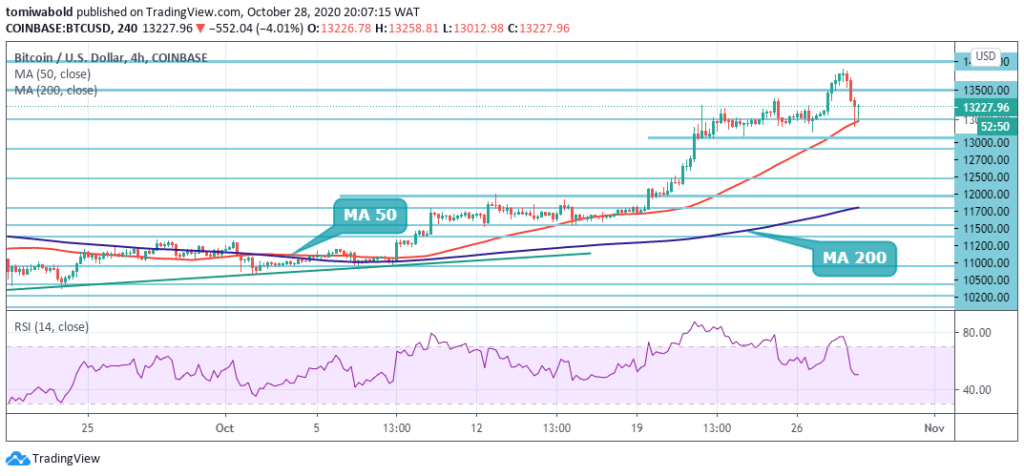
 BTC/USD 4-Hour Chart
Bitcoin rallied to a new 2020 high in the shorter time frame, breaching past the $13,500 resistance mark. Technical analysis suggests that, as the ongoing breakout advance reveals few signs of halting, the bulls may target the $14,000 area. Traders who are bullish towards the pair of BTC/USD may look to buy any technical pullbacks towards the level of $13,000.
The 4-hour BTC/USD chart shows the MA 50 as a selling pressure backstop that may trigger a strong rebound. The BTC/USD pair is only bullish while exchanging beyond the level of $12,700, with main resistance at the highs of $13,500 and $14,000. If the BTC/USD pair exchanges underneath the $12,700 mark, the $12,500 and $12,000 levels may be tested by sellers.
Note: Kryptomoney.com is not a financial advisor. Do your research before investing your funds in any financial asset or presented product or event. We are not responsible for your investing results
Image Credit: Shutterstock
Keep in mind that we may receive commissions when you click our links and make purchases. However, this does not impact our reviews and comparisons. We try our best to keep things fair and balanced, in order to help you make the best choice for you.