
Nearly all of the Bitcoin fundamentals have continued to deliver signs of growth or ripped past multi-month range peaks lately. Today, BTC/USD has peaked more than $12,000 as it keeps progressing into a full-blown bull market. The world’s largest cryptocurrency now has a market cap of more than $221 billion, the highest level since it initially surged to as high as $14,000 in June 2019. Its recent performance has continued after hitting $12k, as BTC/USD relaunches traction to $14k. An intraday high was traded at $12,086 which marks a temporary stop to the rally that has eyes fixated at $14,000. At the time of this post, BTC/USD traded at $11,821, after a 2.90 percent gain on the day. Bitcoin’s price pattern snaps bullish as positive sentiment from both retail and institutional investors returns across the entire industry. Investors instinctively rush to speculative assets in times of volatility such as these, in the shortest time, striving for the highest returns.
*Today, BTC/USD has peaked more than $12,000 as it keeps progressing into a full-blown bull market
*Its recent performance has continued after hitting $12k, as BTC/USD relaunches traction to $14k
*Bitcoin’s price pattern snaps bullish as positive sentiment from both retail and institutional investors returns across the entire industry
Key Levels
Resistance Levels: $14,000, $13,500, $12,340
Support Levels: $11,500, $10,500, $9,500
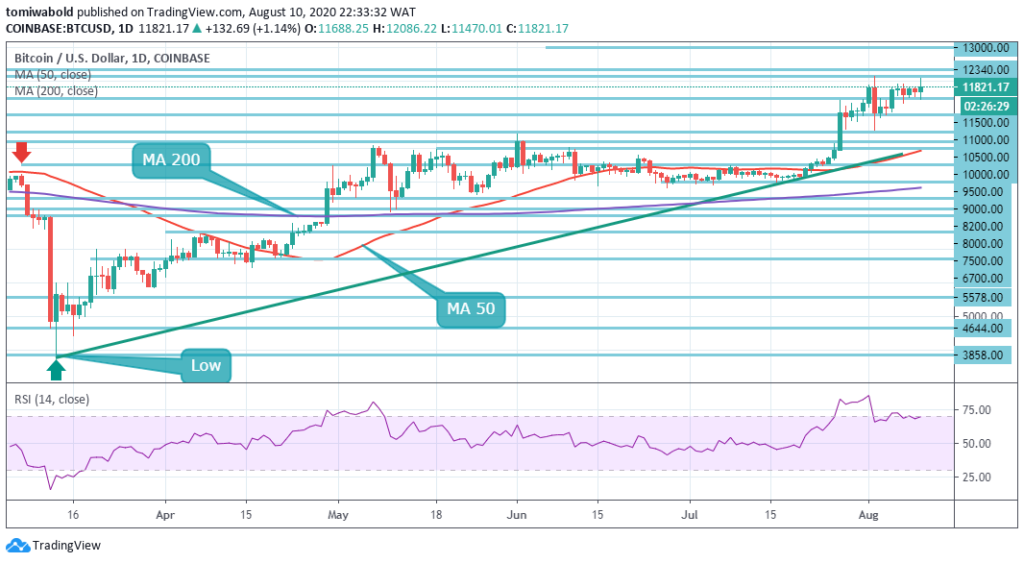 BTC/USD Daily Chart
Bitcoin price rips out past $12,000 before swiftly retreating to $11,821 current market level. The bulls increased the market action to $12,086 (intraday) but lost traction until it breached a $12,000 seller pressure. As mentioned earlier in the price prediction post, given the retreat BTC stays in the bulls’ pockets. To be on the side of caution, besides that, Bitcoin bulls must concentrate on creating support beyond $12,000.
On the support side, it’s worth noting that the RSI is overbought and it signals a possible upward trend reversal. A daily exit beneath the present market zone’s low end may lead to Bitcoin’s decline at $11,500 under the horizontal support. Should prices move beneath the nearby swing low at $11,000 where more selling stops could be triggered, selling could intensify.
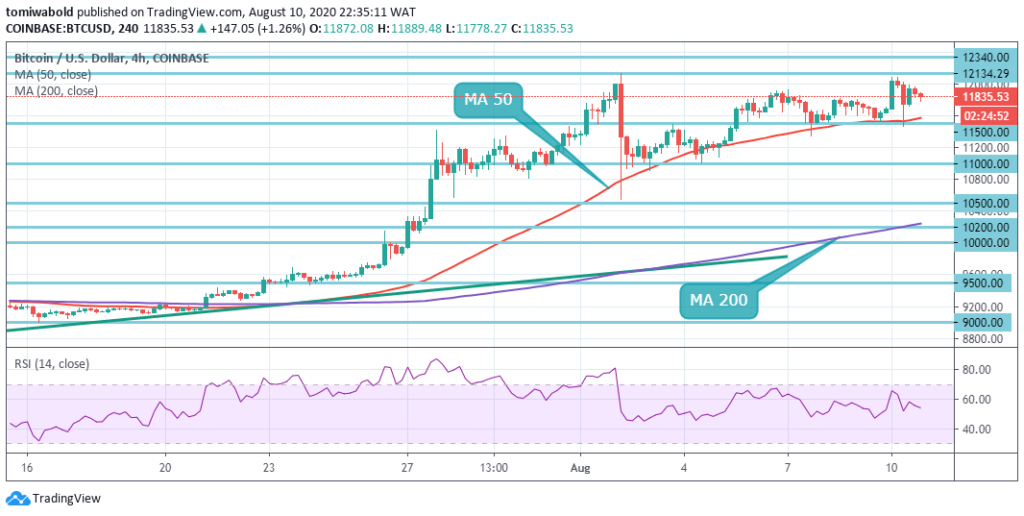 BTC/USD 4-Hour Chart
The 4-hour time frame reveals Bitcoin trading even as the new trading week begins in a tight price range, while the number one cryptocurrency readies for its next major directional move. BTC/USD bulls have to breach the resistance level of $12,134 to motivate additional gains toward the level of $12,340. On the contrary, persistent weakness beneath the level of $11,500 may cause technical selling toward the region of $10,500.
From a technical viewpoint, the next hurdle for Bitcoin is the level of resistance of $12,134, as this was a point of rejection before a potential market collapse to $10,500. The BTC/USD pair is only bullish while exchanging beyond the level of $11,500, with near-term resistance at $12,134 and the $12,340 levels. Sellers may test the $11,000 and $10,500 levels once the BTC/USD pair exchanges beneath the $11,500 level.
Note: Kryptomoney.com is not a financial advisor. Do your research before investing your funds in any financial asset or presented product or event. We are not responsible for your investing results
Image Credit: Shutterstock


Keep in mind that we may receive commissions when you click our links and make purchases. However, this does not impact our reviews and comparisons. We try our best to keep things fair and balanced, in order to help you make the best choice for you.
