Finally, Bitcoin regains a price level not attained before the massive price plunge in March, reaffirming its pre-halving sentiment by bulls. Bitcoin (BTC) price finally regains past $8,200 on April 29 as a steady week of progress held bolstering markets. CoinMarketCap data revealed that, after a seven-week pause, BTC/USD has now breached the $8,200. The first digital coin is currently changing hands at $8,315, but the traction on the upside is increasing. The shift decisively overturns the plunge of Bitcoin in mid-March, after which the crypto-currency drops to $3,858 in a day to record 15-month lows. The optimism continues to gain upward as Bitcoin Bullish strike returns due to the Block reward halving sentiment. The event is only two weeks away with mainstream media observing this as a possible indicator of the “Latest Bitcoin millionaires group.”
*CoinMarketCap data revealed that, after a seven-week pause, BTC/USD has now breached the $8,200
*The first digital coin is currently changing hands at $8,315, but the traction on the upside is increasing
*The optimism continues to gain upward as Bitcoin Bullish strike returns due to the Block reward halving sentiment
Key Levels
Resistance Levels: $9,200, $8,800, $8,500
Support Levels: $8,000, $7,500, $7,300
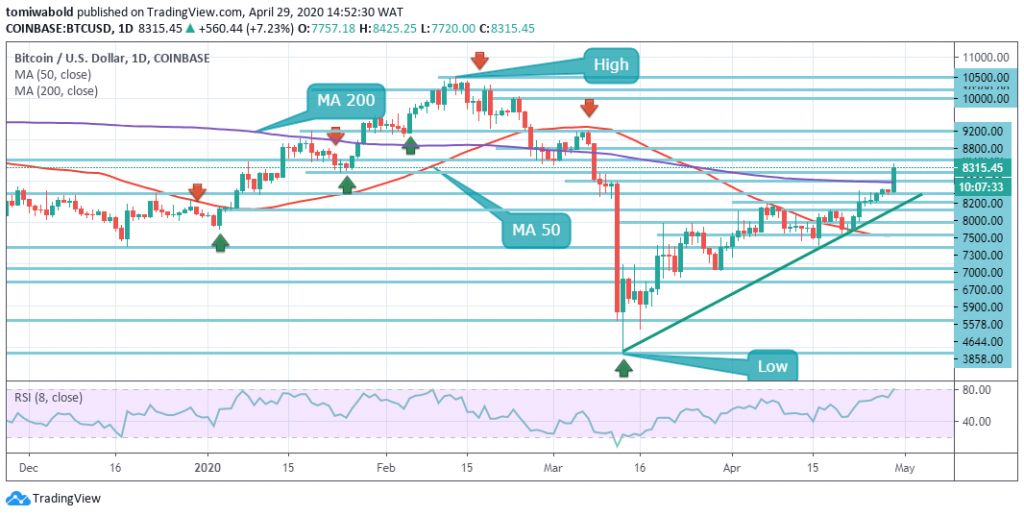
BTC/USD pushed past $8,200 after breaching through $8,000. The first digital coin at the time of writing is increasing in value at $8,315, but the traction on the upside is increasing. A steady push past this region has built a strong bullish sentiment and enabled Bitcoin to also rise to $8,500 because it’s the next critical threshold.
This previous resistance established by a pairing of 61.8 percent retracement to shift downside from high February 2020 and daily MA 200, currently acts as strong support. The first digital coin’s price has gained more than 7 percent as of the beginning of the day. BTC/USD is on a medium-term bullish trajectory as volatility increases.
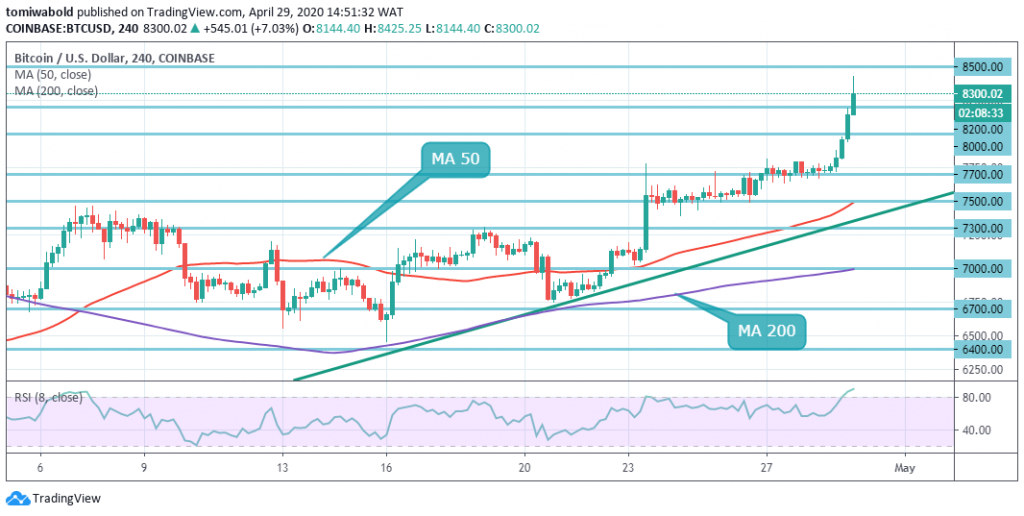
BTC/USD is massively overbought on the intraday charts, but the RSI has shown no indications of reversal as of now. This implies that the traction on the upside may keep gaining strength. If $8,500 is broken, the target maybe $8,800. The confluence zone provides this resistance in late Feb. As of March 8, BTC/USD has since been exchanging under this convergence region.
At the downside, a previous psychological $8,000 provides the initial support. Taking into consideration that this support has acted as significant resistance, supported by daily MA 200, the reversal is probably to be stalled and a further bullish phase initiated. If it’s breached, nonetheless, the sell-off will move to $7,500, this limit has acted as a level of resistance in past days, now it’s being strengthened by 4-hour MA 50. Once it is breached, the sell-off may go on to $7,300 with the ascending trendline beneath the psychological barrier.
Note: Kryptomoney.com is not a financial advisor. Do your research before investing your funds in any financial asset or presented product or event. We are not responsible for your investing results
Image Credit: Shutterstock


Keep in mind that we may receive commissions when you click our links and make purchases. However, this does not impact our reviews and comparisons. We try our best to keep things fair and balanced, in order to help you make the best choice for you.