
The first cryptocurrency lost more than $1000 on the US opening in 15 minutes. Close to $10 billion was wiped from the cryptocurrency market in minutes when Bitcoin plunged beneath $10,000 and reached the $9,270 level. BTC/USD is changing hands at $9,529 at the time of posting, down 7 percent from the day’s start. After registering past $10,400, the coin erased all Monday gains, and reverted to the prior levels. Although the sell-off trigger appears sketchy its speculated that it’s as a result of liquidations on CME Bitcoin futures market. Till the short squeeze took place, the funding rate for Bitcoin hovered at around 0.16 percent which was too high and about 75 percent of the market was retaining long contracts as a large percentage of traders anticipated Bitcoin’s price to skyrocket and actively buying at the price. Predictably, there was a long squeeze, which liquidated long contracts worth approximately $120 million.
*BTC/USD is changing hands at $9,529 at the time of posting, down 7 percent from the day’s start
*After registering past $10,400, the coin erased all Monday gains, and reverted to the prior levels
*Although the sell-off trigger appears sketchy its speculated that it’s as a result of liquidations on CME Bitcoin futures market
Key Levels
Resistance Levels: $11,000, $10,500, $10,000,
Support levels: $9,200, $8,800, $8,500
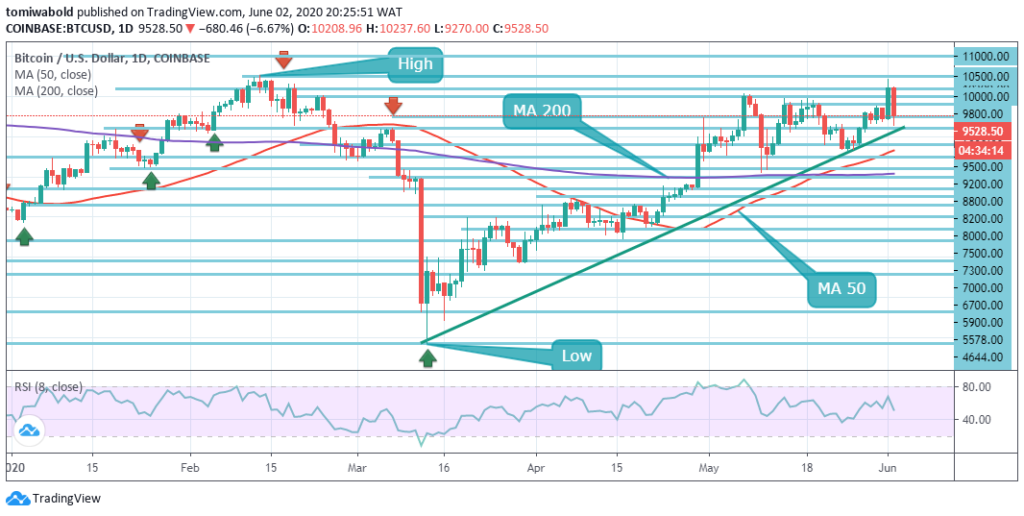 BTC/USD Daily Chart
In the previous day, Bitcoin launched a dominant upside rally past the $10,400 mark, following a breakout beyond the $10,000 level of resistance. Following the upside rebound, the BTC/USD pair pulled a quick technical correction and retraced nearly 7 percent daily in an attempt to test the level of $9,200 before rising further. All in all, over the medium to long term, the BTC/USD pair may still advance toward the $11,000 level.
In the last eight months, Bitcoin has tested the $10,500 level of resistance three times in succession. The BTC/USD pair is only bullish whilst still exchanging beyond the level of $9,500; pivotal resistance is found at the levels of $10,500 and $11,500. Once the BTC/USD pair sells underneath the level of $9,500, then sellers may test the support levels of $9,200 and $8,800.
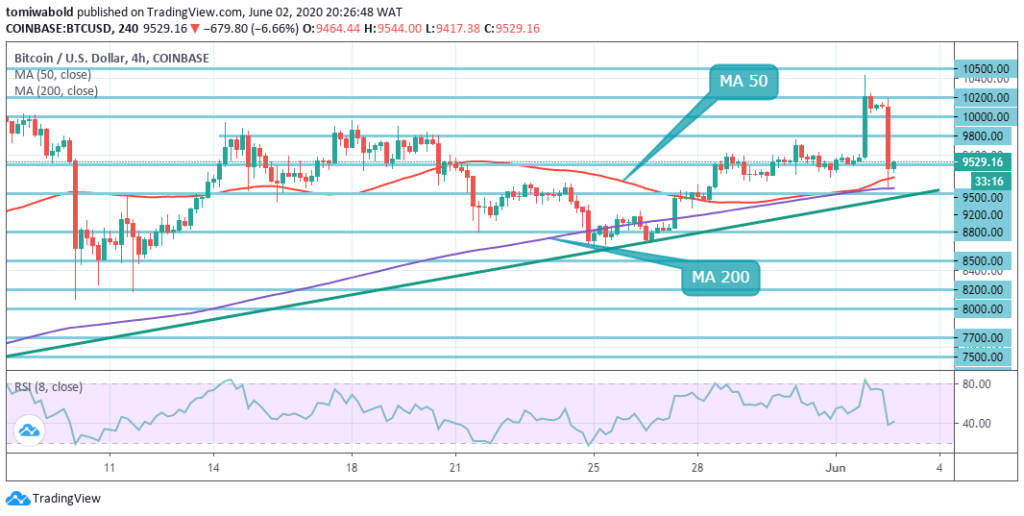 BTC/USD 4-Hour Chart
Following the plunge, Bitcoin (BTC) is attempting to consolidate in an uptrend as seen on the 4-hour time frame. It presently bounces off the MA 200 and MA 50 short-term and is supported by the ascending trendline, which normally functions as a continuation trend. The next level down is a $9,200 support position. In this chart, however, there have been three times on which the range of $9,200 has been used reactionarily. There is another support zone underneath here, corresponding to $8,800.
Aside from the RSI, the technicals on the chart all lead to a bullish reversal but it seems like the bulls may lose steam. The Relative Strength Index is below the midpoint of 50 but there is still a downward shift from the past 2 price swings. This suggests it may provide support if the market falls downward. The bulls are inclined to use the ascending trendline support as a launchpad, but a continuous fresh downtrend is probable if that level is breached.
Note: Kryptomoney.com is not a financial advisor. Do your research before investing your funds in any financial asset or presented product or event. We are not responsible for your investing results
Image Credit: Shutterstock


Keep in mind that we may receive commissions when you click our links and make purchases. However, this does not impact our reviews and comparisons. We try our best to keep things fair and balanced, in order to help you make the best choice for you.