
The lead crypto Bitcoin (BTC) has powered to a new yearly high against the US dollar, with the pair finally reaching highs of $20,907 since inception. At present BTC has recorded its best year since 2017 despite the massive plunge to a multi-year low of $3,800 in March 2020. After stalling its decline around $17,580, at last, BTC/USD attains an upside breakout past $20,000. Buyers at all costs have limited selling pressure at $20,000 preventing trading levels under this zone. The Bitcoin (BTC) market cap is currently $383 billion, with $38.58 billion traded in the past 24 hours. BTC/USD hit the $20,907 all-time high on Wednesday and retreated to $20,718 by the time of writing. BTC has gained nearly 7% on a day-to-day basis, moving within a strong bullish trend. The cryptocurrency sphere is awaiting congress to pass a $748 Billion stimulus and spending bill that might boost Bitcoin prices. BTC/USD received a boost on Wednesday over growing optimism that Republican and Democrat politicians are going to agree on the new stimulus package.
*After stalling its decline around $17,580, at last, BTC/USD attains upside breakout past $20,000
*Buyers at all costs have limited selling pressure at $20,000 preventing trading levels under this zone
*The cryptocurrency sphere is awaiting congress to pass a $748 Billion stimulus and spending bill that might boost the Bitcoin prices
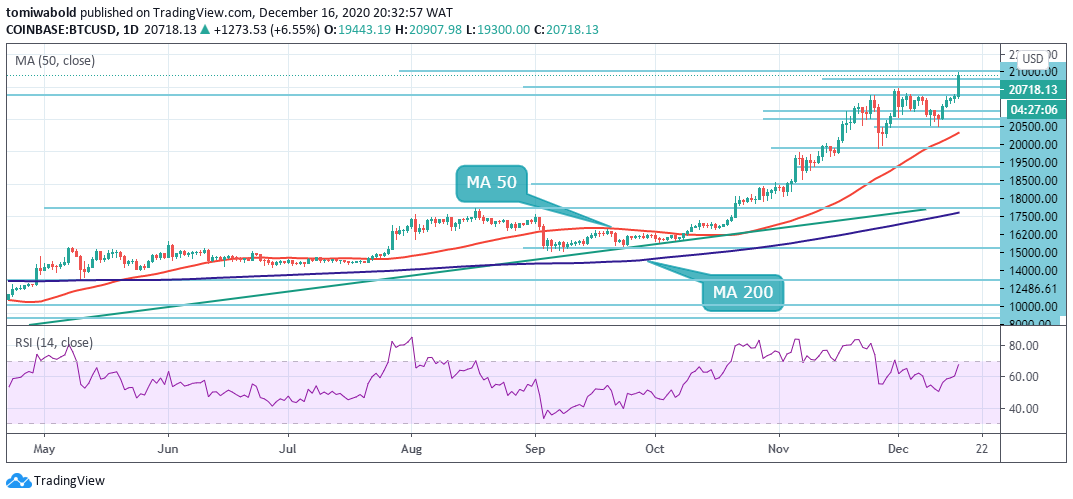 BTC/USD Daily Chart
The BTC/USD pair is consolidating at three-year highs and poised to extend its rally towards new levels not reached before now. BTC/USD is currently trading at $20,718 and up by 7% having traveled from a low of $19,300 to a high of $20,907. A close below $20,000 will likely invalidate the bullish formation and bottoming pattern and lead to higher lows, supporting the BTC higher.
However, on a break below the support at $20,500 the price target and confluence of the daily correction would be highly compelling. A meaningful retracement may come in at $20,000 and can be expected considering how stretched the bullish impulse has been without any significant correction.
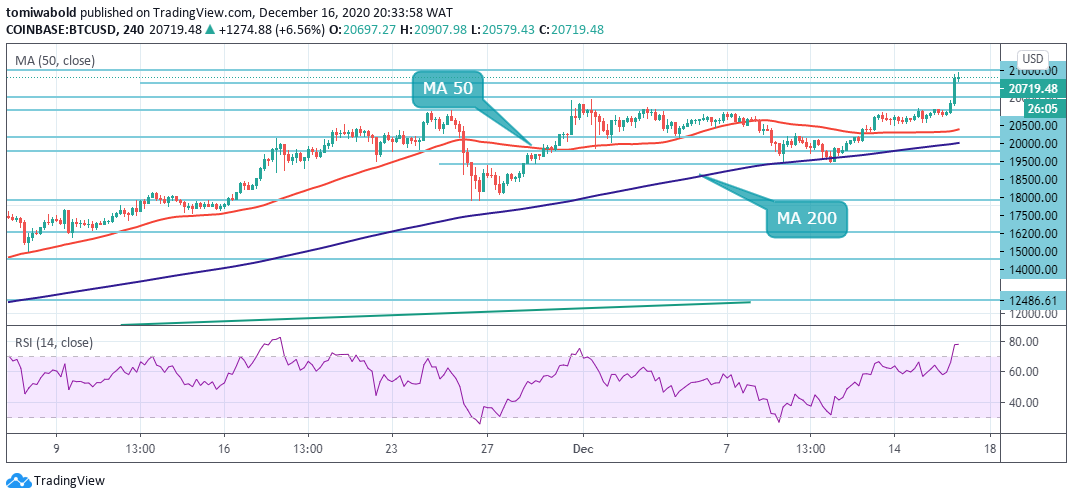 BTC/USD 4-Hour Chart
Technical analysis shows that a breakout above the $21,000 level could see the BTC/USD pair rallying to a fresh all-time high. To the downside, weakness below the $20,500 level could cause a major technical sell-off towards the $20,000 level. From a technical perspective, the above scenario cannot be brushed aside in the 4-hour chart since the RSI is in the overbought territory.
Only sustained failure beneath the $20,500 level could prompt the BTC/USD pair to fall back towards the $20,000 area. The BTC/USD pair is only bullish while trading above the $20,000 level, key resistance is found at the $21,000 and the $21,500 levels. If the BTC/USD pair trades below the $20,500 level, sellers may test the $20,000 and $19,500 levels.
Note: Kryptomoney.com is not a financial advisor. Do your research before investing your funds in any financial asset or presented product or event. We are not responsible for your investing results
Image Credit: Shutterstock


Keep in mind that we may receive commissions when you click our links and make purchases. However, this does not impact our reviews and comparisons. We try our best to keep things fair and balanced, in order to help you make the best choice for you.
