
Bitcoin stays with trends on the stock markets, driven by concerns regarding coronavirus and trade disputes between the U.S. and China. The outlook has been hard to alter and has been liable for the trading range in which BTC/USD is not yet able to traverse since June. BTC/USD tumbled from $9216 into Thursday’s American session as bears hijack bias to $9000. Bitcoin price is trading 1 percent lower at $9107 with a decline in trading volumes to $16.6 billion indicating that current levels may increase volatility. CryptoQuant, on-chain analytics tool reported inflows of Bitcoin (BTC) to exchanges surged on July 15 as seen on Kraken exchange revealing that 4,229 BTC ($38.5 million) arrived — more than the average of 500 BTC ($4.55 million). This might pose a phenomenon not representing wide investor sentiments. Earlier, exchange balances were experiencing a long-term downtrend that reached its lowest since late 2018 in May.
*Bitcoin price is trading 1 percent lower at $9107 with a decline in trading volumes to $16.6 billion indicating that current levels may increase volatility
*BTC/USD tumbled from $9216 into Thursday’s American session as bears hijack bias to $9000
*CryptoQuant, on-chain analytics tool reported inflows of Bitcoin (BTC) to exchanges surged on July 15 as seen on Kraken exchange revealing that 4,229 BTC ($38.5 million) arrived
Key Levels
Resistance Levels: $9,800, $9,500, $9,200
Support levels: $8,800, $8,500 $8,200
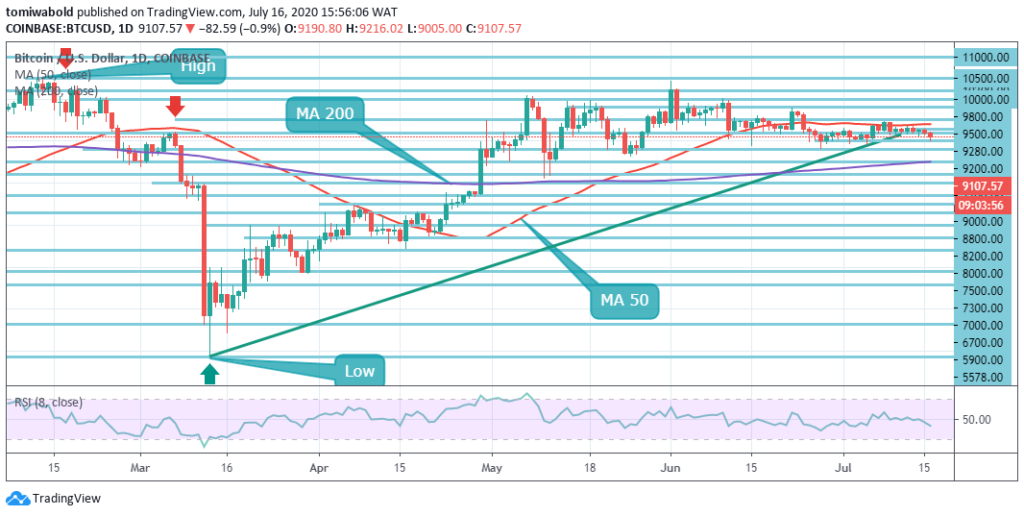 BTC/USD Daily Chart
Bitcoin withstood quite seamlessly the losses, trading at $9,005 intraday low. The price also is hovering beneath $9,200 with a low probability of a higher correction on the day. Whatever else, there is a downward direction of least resistance, a scenario that might impose further pressure on the support at $9,000 and $8,800 areas simultaneously.
Technically, medium-term bearish control of Bitcoin may occur. All the factors outlined the potential of inspiring breakdown levels beneath $9,000. Increased support, at $8,800 and $8,500, is anticipated. Though previously, both of these zones served as support. Thus investors have a competitive opportunity to hold in on the same areas as BTC gear up its next push to $10,000.
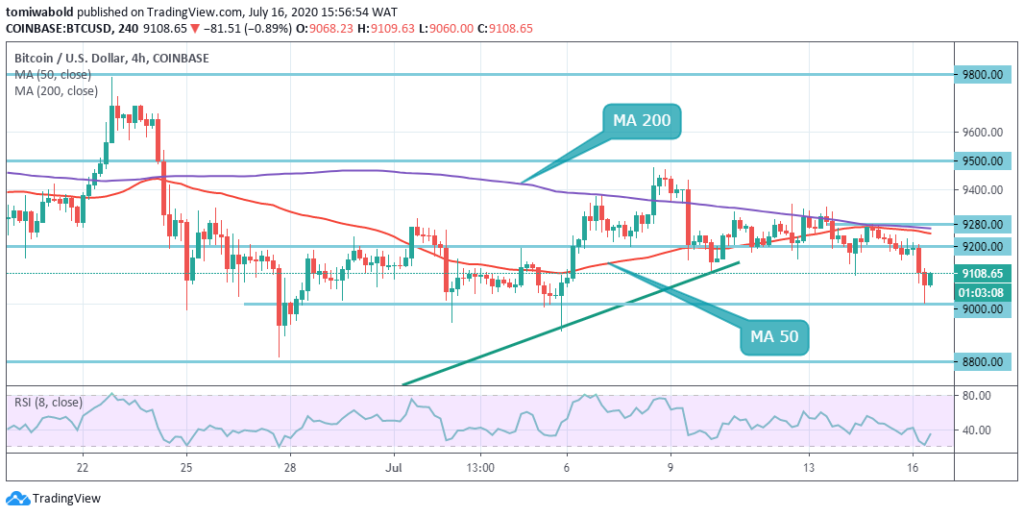 BTC/USD 4-Hour Chart
BTC/USD is rapidly shifting within a short-term bearish trend on the shorter time frame, and the volatility is high. There are a few technical barriers stacked beyond the present level, although there is a straight path to the South. It means Bitcoin may at this phase be exposed to further losses, while the bulls may have tough traction in ramping up.
BTC/USD has high levels of resistance at $9280 around 4 hour MA 50, led by $9,500 and $9,800. Decent support on the downside sits at a horizontal support level of $9000. A continuous shift beyond the level of $9280 may rally the BTC/USD pair to the recent monthly high of $9475. To the negative side, the BTC/USD pair may consider a breach beneath the $8,800 support level as enormously bearish.
Note: Kryptomoney.com is not a financial advisor. Do your research before investing your funds in any financial asset or presented product or event. We are not responsible for your investing results
Image Credit: Shutterstock


Keep in mind that we may receive commissions when you click our links and make purchases. However, this does not impact our reviews and comparisons. We try our best to keep things fair and balanced, in order to help you make the best choice for you.
