
Bitcoin (BTC) stayed near $23,000 on Saturday in anticipation of the Federal Open Market Committee’s interest rate decision next week and any signals that policymakers might give regarding when their rate hike campaign might cease. The price of the biggest cryptocurrency by market capitalization just dropped to roughly $22,998, representing a 1.14% daily decline. Funding rates for BTC are currently around 0.01%, which indicates that traders’ sentiment toward the market is bullish but is “still far from the 0.06% levels recorded in February or November of 2021 when traders were paying 80% more annualized to long bitcoin.” According to Lucas Outumuro, head of analysis firm IntoTheBlock, the current levels in derivatives show the market is optimistic, but at the same time, it has not yet reached an overheated state, which could provide reasons for the current rise to continue.
Key Levels
Resistance Levels: $30,000, $27,000, $25,000
Support Levels: $22,000, $20,000, $18,000
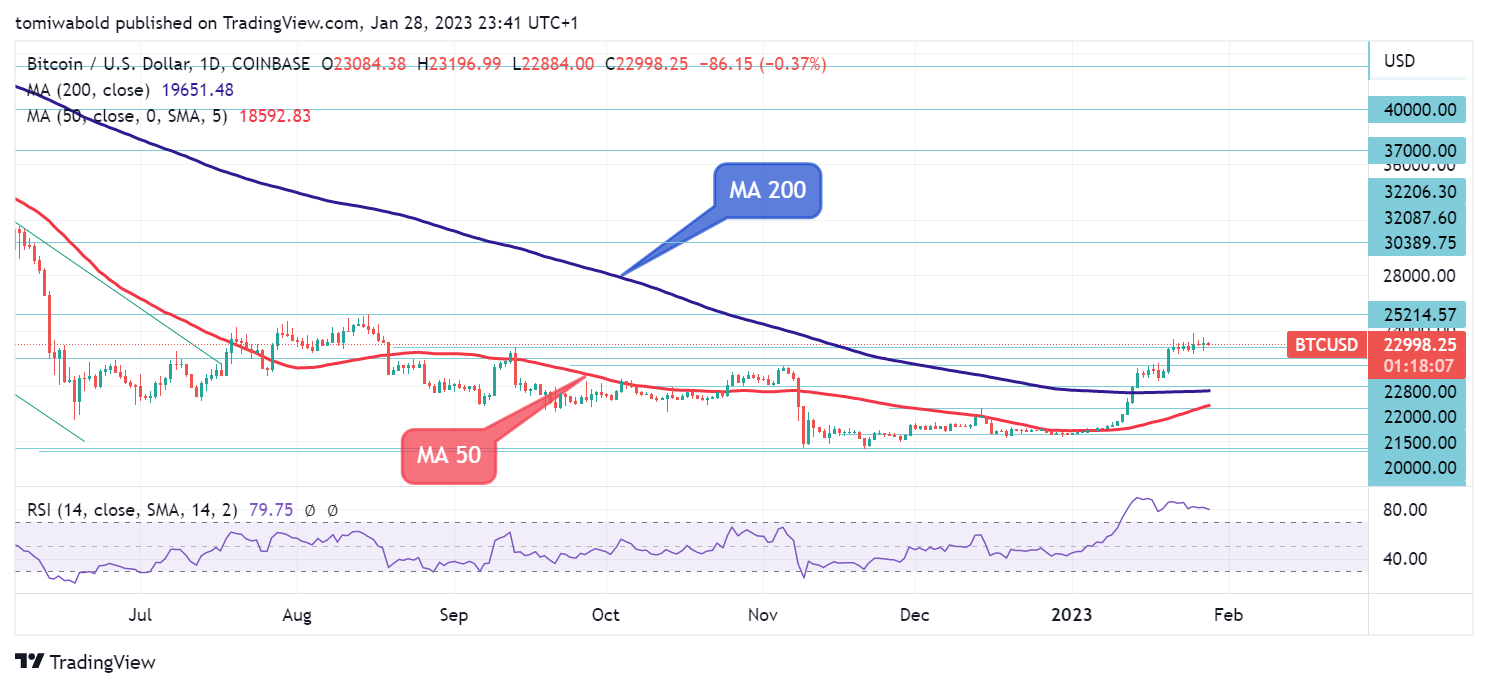 BTC/USD Daily Chart
The analysis indicates increasing positive momentum past the daily moving averages (MA 200 & 50), and it also predicts a small correction before bulls continue the upside traction. Bullish sentiment is what is sustaining the run at the upside after a minor retreat under $23,000 as seen on the daily chart. It is noteworthy that if the BTC/USD pair crosses the $21,000 level, a much more significant bullish reversal pattern might be in play.
The primary goal of traders will be to exit positions at psychological resistance above the $25,000 region, but they need to exercise caution if these levels are broken because doing so might pave the way for another run and reveal levels around the $30,000 region. Fresh weakness, however, would portend a continuation of the retracement from $23,824 (high of January 25), where greater bulls paused.
 BTC/USD 4-Hour Chart
The BTC/USD pair has remained in upside consolidation since January 23 rebound, when it bounced from a $20,370 low. On the four-hour chart, the pair is still above all moving averages (MA 50). While indicators like the relative strength index (RSI) are still above their midlines and in the uptrend. Additionally, a higher low pattern has emerged. The pair will therefore keep moving higher as bulls pursue the next psychological level of $25,000.
Bitcoin developed strong support against the USD between $21,500 and $20,000, thus the pair may start to move over the $23,000 mark once more. Only when the price of the pair is trading over $24,000 is it considered to return bullish. The primary resistance levels are $25,000 and $30,000.
Note: Kryptomoney.com is not a financial advisor. Do your research before investing your funds in any financial asset or presented product or event. We are not responsible for your investing results
Image Credit: Shutterstock


Keep in mind that we may receive commissions when you click our links and make purchases. However, this does not impact our reviews and comparisons. We try our best to keep things fair and balanced, in order to help you make the best choice for you.