
Bitcoin’s bullish case takes center stage after breaking its former all-time high of $61,788 hours ago to a fresh peak. The overall cryptocurrency market cheered the upside advance as most of the top coins established new all-time highs. For the first time, one BTC is worth almost $64,000. It took some time for Bitcoin to break the $60k again, but in a massive jump, it was able to break the important level and is now in sideways movement. At the time of writing, BTC/USD recorded an all-time high of $63,774 with gains of almost 7% within $24 hrs. A new all-time high hits world news and will push more Bitcoin investors. The mood in cryptocurrencies turned upbeat again before Coinbase goes public. In one of the clearest signs that Wall Street is accepting cryptocurrencies, Coinbase will go public on the Nasdaq on April 14 for about $100 billion (and then likely to skyrocket). Some traders have also jumped into cryptocurrencies as other markets have been trending sideways amid growing concerns about inflation.
*Bitcoin (BTC) bullish case takes center stage after breaking its former all-time high of $61,788
*BTC/USD recorded an all-time high of $63,774 with gains of almost 7% within 24 hrs
*Coinbase will go public on the Nasdaq for about $100 billion
Key Levels
Resistance Levels: $70,000, $68,000, $65,000
Support Levels: $62,000, $60,000, $58,000
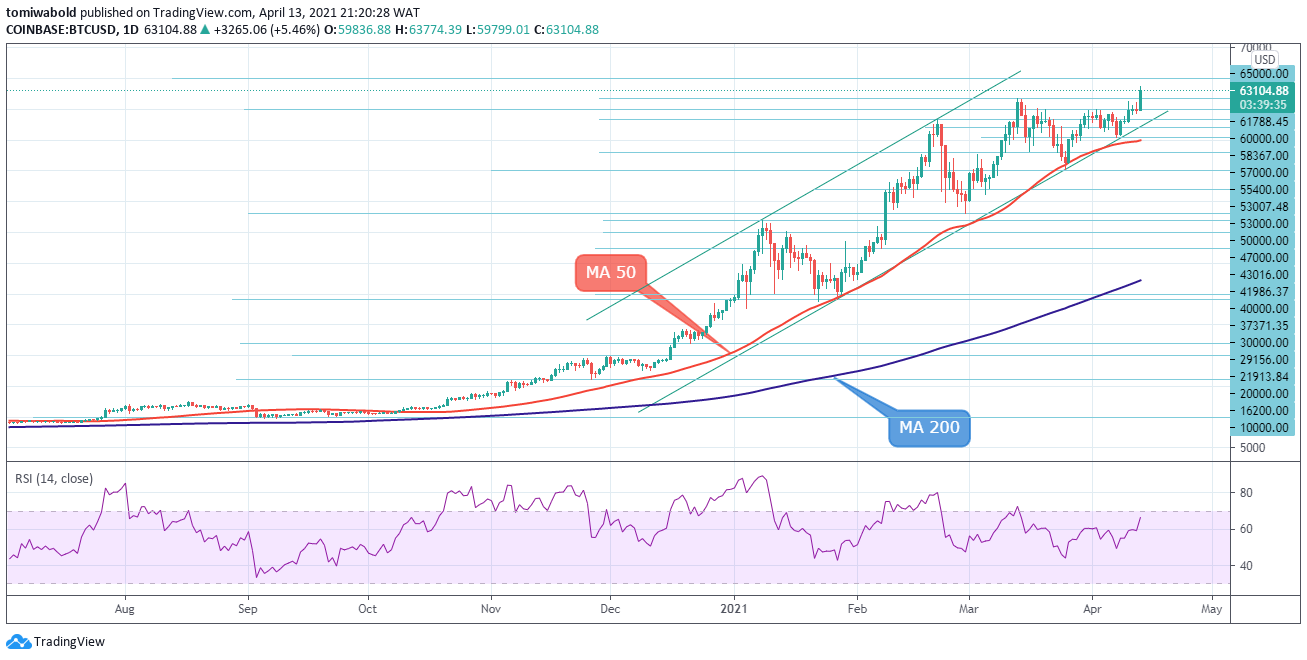 BTC/USD Daily Chart
After hitting an initial high earlier in the US session, BTC/USD pushed back above the $63,000 mark, breaking the cloud and the horizontal barrier on the daily chart. The leading cryptocurrency price remains between $64,000 and $59,000. Bullish behavior above the moving average (MA 50) seems to have weakened significantly and they are now promoting a more ranked price picture, but technically bullish.
The Relative Strength Index (MA 50) is still overbought and has more room for upside for BTC/USD to move towards the $70,000 zone. If buyers push the price higher, initial resistance could come from the $65,000 barrier. Alternatively, if sellers reappear, they may face an overwhelmed support cluster from the ascending trendline and moving average (MA 50) near the $55,400 level. If the mentioned base fails to prevent further loss of positions, the price could fall to the lower obstacle of $50,000.
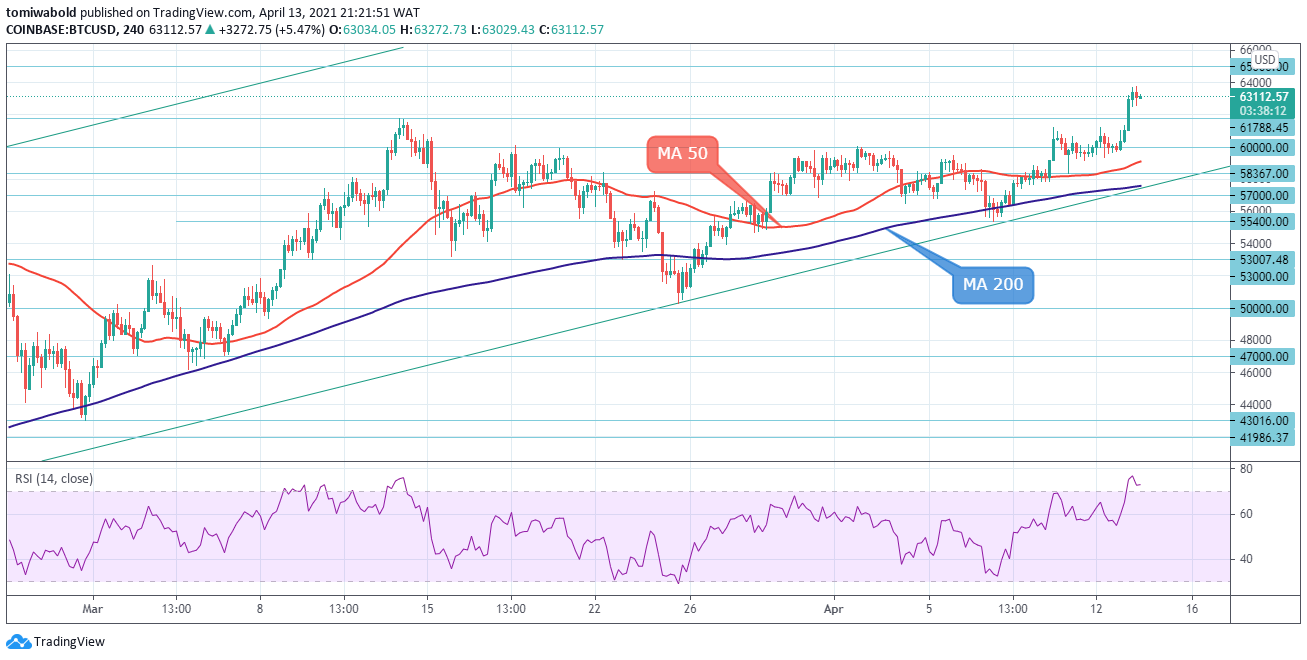 BTC/USD 4-Hour Chart
BTC/USD bulls take center stage on the lower timeframe as the market moves up towards the $64,000 level. Traders await further positive momentum, such as a Coinbase listing, and the reaction will be an important signal of how much of the growth is already priced in by the markets. The $60,000 level now acts as a buy/sell confluence zone, a break below which could define the downside of BTC.
However, if buyers successfully hold the price above the $60,000 level, they will need to overcome the expected $65,000 roof from the sideways pattern to build confidence in upside potential. Exceeding the upper end of the range could push the price towards another resistance area between $68,000 and $70,000. The BTC/USD pair is bullish only when it is trading above $59,100 and the MA 50 zone.
Note: Kryptomoney.com is not a financial advisor. Do your research before investing your funds in any financial asset or presented product or event. We are not responsible for your investing results
Image Credit: Shutterstock


Keep in mind that we may receive commissions when you click our links and make purchases. However, this does not impact our reviews and comparisons. We try our best to keep things fair and balanced, in order to help you make the best choice for you.