
Bitcoin witnessed a bullish return from the recent crash early in the week. Bitcoin fell after hitting fresh yearly highs and lost key levels of support. Presently, the cryptocurrency markets are relatively stable, with BTC/USD relatively unaltered both daily and since the start of the day amidst low volatility. Bitcoin is slowly building a key support level beyond the level of $10,500, after a recent surge past $12,000. During the crash, the price has risen from $10,546 to $11,486.65 passing the key threshold of $11,000. BTC/USD bulls consolidate around $11k on its journey to retain upside traction to assault beyond $12k. Early in the day, BTC/USD assaulted the intraday high beyond $11,400 and retreated to $11,228 by press time. The market dominance of the coin fell to 60.3 percent as some key Altcoins, like Ethereum, do much better. Bitcoin (BTC) Metric Flashes green implying that there has been no disruption to the uptrend and that BTC prices may continue to rise. During the recent crash, Santiment reported an increase in the number of whales referring to addresses holding between 1,000 and 10,000 BTC with the emergence of roughly three new Whales.
*Bitcoin is slowly building a key support level beyond the level of $10,500, after a recent surge past $12,000
*BTC/USD bulls consolidate around $11k on its journey to retain upside traction to assault beyond $12k
*Bitcoin (BTC) Metric Flashes green implying that there has been no disruption to the uptrend and that BTC prices may continue to rise
Key Levels
Resistance Levels: $13,500, $12,300, $11,500
Support Levels: $10,500, $10,000, $9,500
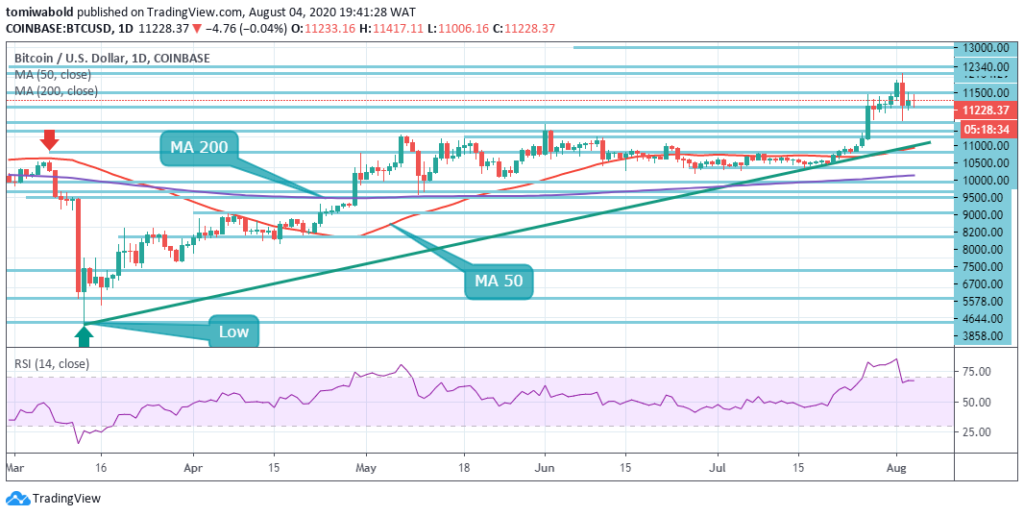 BTC/USD Daily Chart
The daily price analysis suggests that the bulls must surmount the level of horizontal resistance of $11,500 to continue the trajectory upward. Though it stays within the medium-term pattern of bullishness amid declining volatility. The recent dip to $10,546 has improved the outlook for the next phase on the coins. Once Bitcoin registers a deeper pullback, the ascending trendline and the $10,200, MA 50 can be used by bulls as support levels.
The key resistance level on the daily chart is $12,134 followed by $12,325, August 2019 high, and finally the $13,500 mark. There are other technical obstacles beneath the current price and beyond. This implies that BTC/USD may continue consolidating gains at the current levels; nonetheless, the outlook remains bullish in the long run, as long as the price is beyond $11,000.
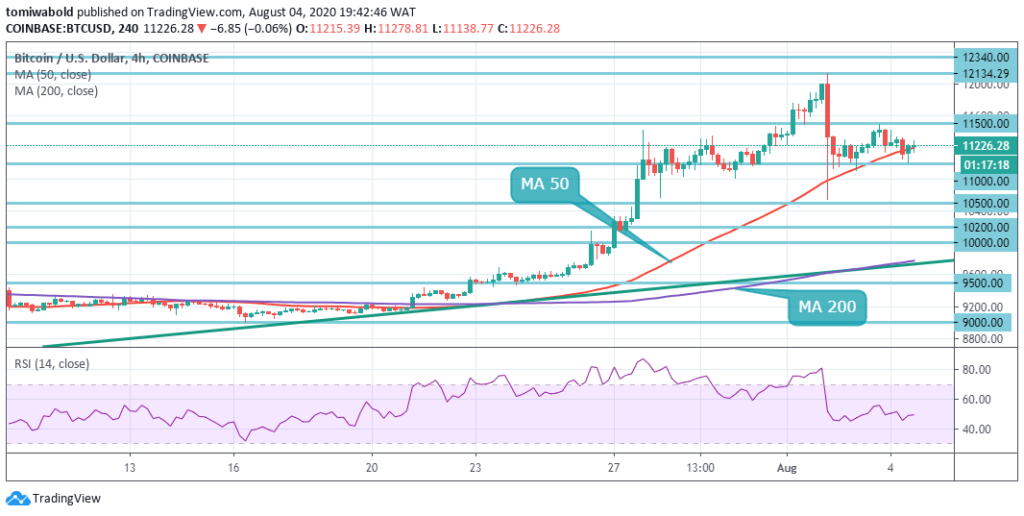 BTC/USD 4-Hour Chart
In the shorter time frame, Bitcoin seems susceptible to further drops in price, as the cryptocurrency fails to rise beyond the level of $11,500. To draw fresh technical potential buyers over the short to medium term, the BTC/USD pair may have to step back under the $11,000 level. Short-term BTC/USD bears may consider selling any decline toward the level of $10,500 in anticipation of a fall to follow.
The bulls may be tested towards the $12,000 level in the alternative scenario when price trades beyond the $11,000 mark. The BTC/USD pair is only bullish while trading beyond the level of $10,500, the main resistance is seen at the levels of $12,134 and $12,300. Once the BTC/USD pair moves beneath the $11,000 level, sellers may test support levels of $10,500 and $10,200.
Note: Kryptomoney.com is not a financial advisor. Do your research before investing your funds in any financial asset or presented product or event. We are not responsible for your investing results
Image Credit: Shutterstock


Keep in mind that we may receive commissions when you click our links and make purchases. However, this does not impact our reviews and comparisons. We try our best to keep things fair and balanced, in order to help you make the best choice for you.