The entire cryptocurrency market had a great week gaining close to $30 billion in market capitalization. Bitcoin and other major coins suffered a slight pullback. Bitcoin (BTC) remains on its path to attempt a breakout of $12,000, after seeing rejection at $11,700 this week. Despite a significant surge BTC/USD bulls pullback to charge beyond $12k. BTC registered an intraday low at $11,263 but is showing bullish signs again after a brief and healthy consolidation period. According to data by CoinMarketCap, the BTC market cap stands at $212.68 billion, while the 24-hour volume holds roughly $23.84 billion. At the time of writing, the flagship cryptocurrency is eying up a re-test of the psychological barrier at $11,700. Bitcoin on-chain metric as indicated by Glassnode reveals 1BTC HODLers spike steadily, posting fresh all-time highs. This is a very healthy sign, as it shows that Bitcoin’s network is growing steadily.
*Bitcoin (BTC) remains on its path to attempt a breakout of $12,000, after seeing rejection at $11,700 this week
*Despite a significant surge BTC/USD bulls pullback to charge beyond $12k
*Bitcoin on-chain metric as indicated by Glassnode reveals 1BTC HODLers spike steadily, posting fresh all-time highs
Key Levels
Resistance Levels: $12,500, $12,000, $11,700
Support Levels: $11,200, $10,500, $10,000
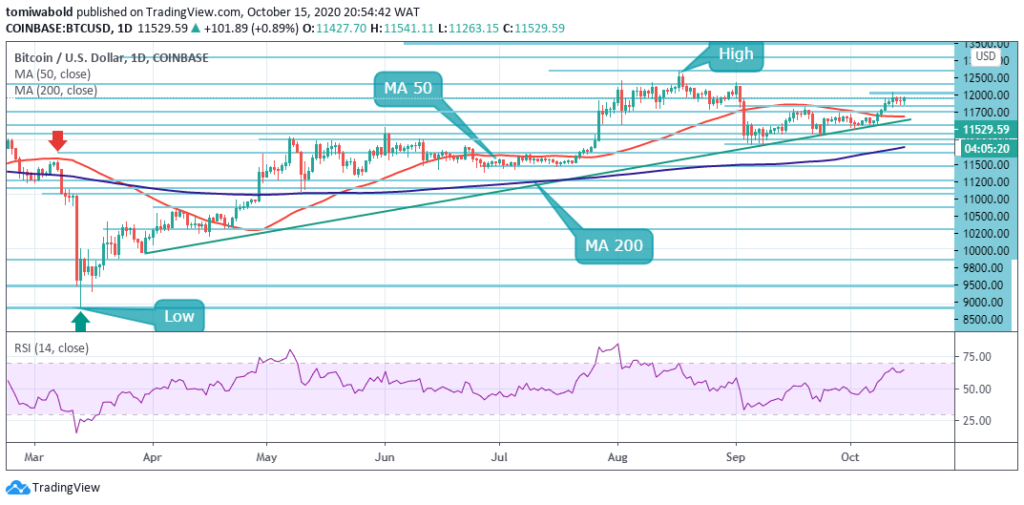
 BTC/USD Daily Chart
At $11,700, the daily chart indicates a heavy resistance, which is driving the price down at present. This has, however, faltered to dampen optimism among buyers, who foresee $11,200 to be retained as solid support. Bullish traction is building beyond $11,500 at the time of writing, while buyers are battling to grind through the $11,600 convergence resistance.
The flagship cryptocurrency is given tremendous support on the downside, as demonstrated by the MA 50 and the ascending trendline. The most stable one inside the cluster of strong support zones varies from $11,200 to $10,500. All in all, the bulls must clear the resistance of $11,700 and smash into the $13,000 zone.
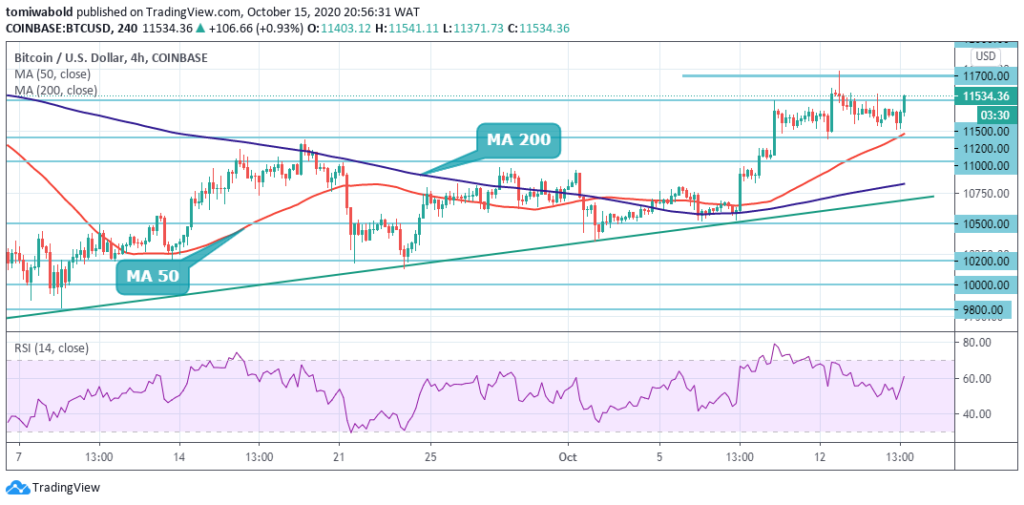
 BTC/USD 4-Hour Chart
Bitcoin is still under buying pressure upon being offered at the $11,700 resistance level. Technical analysis suggests that a significant bullish spike may occur if the BTC/USD pair continues to drift beyond the $11,500 level. A pullback towards the $11,200 to $11,000 region is likely to draw strong dip-buying interest further.
Due to the ongoing short and medium-term bullish trend, buying around the $11,500 region is anticipated. Although trading beyond the $11,200 mark, the BTC/USD pair is only bullish; the main resistance is seen at the $11,500 and $11,700 level. If the BTC/USD pair trades beneath the $11,200 mark, the $11,000 and $10,500 levels can be tested by sellers.
Note: Kryptomoney.com is not a financial advisor. Do your research before investing your funds in any financial asset or presented product or event. We are not responsible for your investing results
Image Credit: Shutterstock
Keep in mind that we may receive commissions when you click our links and make purchases. However, this does not impact our reviews and comparisons. We try our best to keep things fair and balanced, in order to help you make the best choice for you.