
The price of Bitcoin jumped in the American session as investors priced in a supercycle. In the new week, Bitcoin surprised investors by closing above the $61,000 level since April 2021. Many analysts predict that BTC will test the historic high of $64,899, according to forecasts. In October, the Crypto Fear & Greed Index had risen from the Fear Zone to the Greed Zone. However, most spot traders remain bullish amid the risk of a reversal as BTC/USD mid-term forecasts stay positive. The BTC/USD pair gained nearly 15 percent in 7 days to reach a local high of $63,500 at the time of this post. Prices surged and pushed higher after the exchange-traded fund tracking futures contract for the lead crypto began trading today. The 1st Bitcoin-linked exchange-traded fund makes the NYSE market debut on Tuesday, giving brokerage account holders new investment options.
Key Levels
Resistance Levels: $70,000, $68,000, $65,000
Support Levels: $60,000, $57,000, $55,000
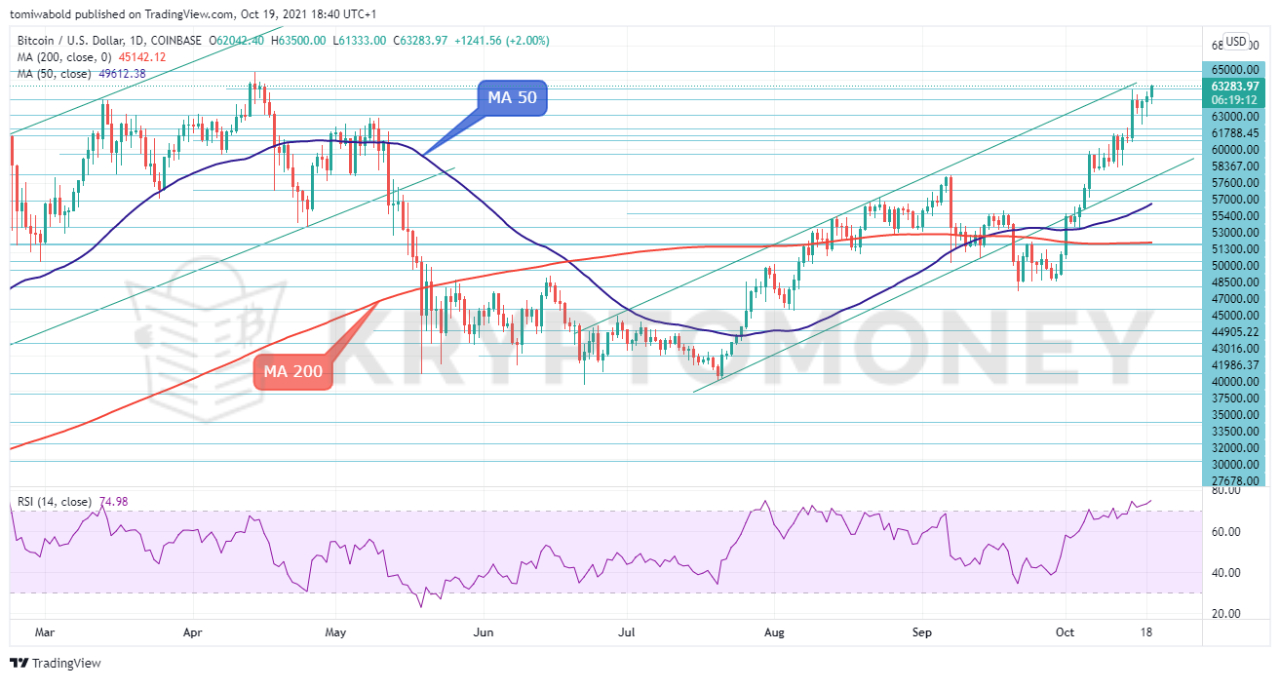 BTC/USD Daily Chart
In the American session, the BTC/USD pair made a bullish breakout past the $63,000. It climbed to a monthly high of $63,500, a significant increase from the previous month’s low of $39,600. The price of the pair has risen above the bullish flag formation. So far, the price is likely to continue climbing as bulls aim for the next significant resistance level of $65,000.
Between the indicators, the bulls continue to have an edge. On the daily chart, the relative strength index indicates that the uptrend will continue. Although at the overbought region beneath 80, it shows more room for growth, while the moving average (MA 200) indicates that it is neutral and the moving average (MA 50) is at $50,000 while awaiting a pullback.
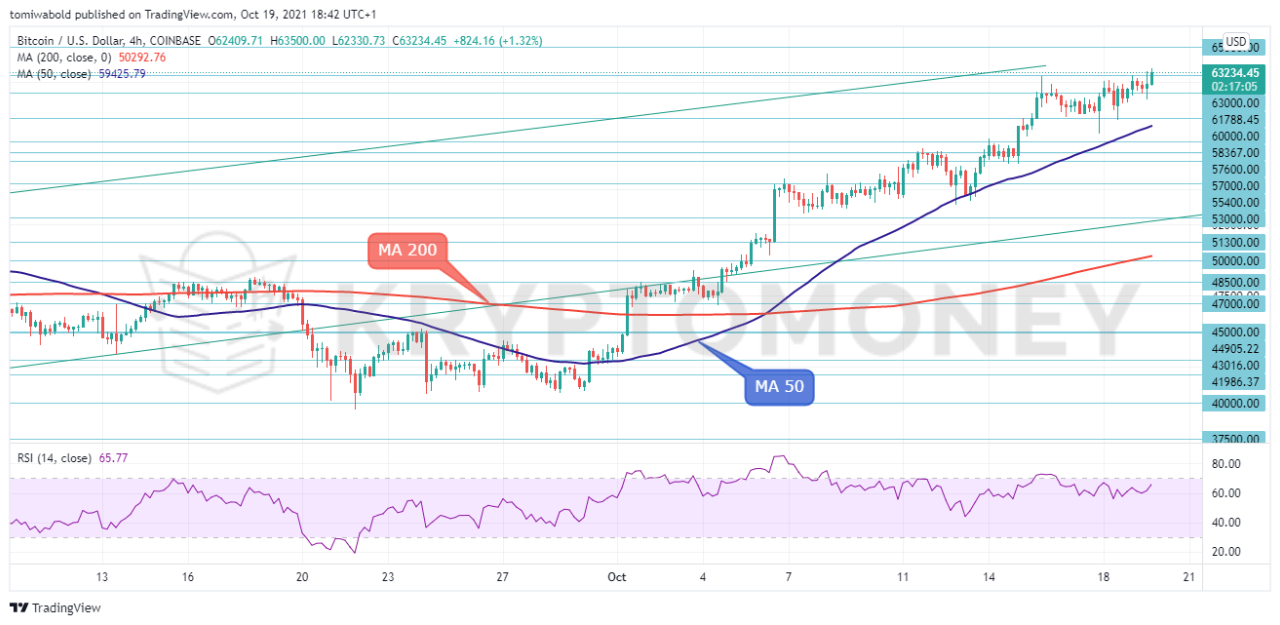 BTC/USD 4-Hour Chart
On the 4-hour time frame, despite breaking out of the ascending channel in September, the BTC/USD pair returns higher at the start of October after passing the channel support of the up pattern. Then the pair approached the 4-hour moving average (MA 50) and the $43,000 level, a recovery began. Should bullish dynamics continue, the market might revisit the all-time high of $64,899 before getting into uncharted zones.
Overall, BTC has strongly rebounded off the $47,000 zone. The momentum indicators now suggest that the market sentiment is back to bullish as the short-term relative strength index remains in a positive region, holding above its midline since September with more positive movements. The next targets could come from $63,000 zone to $65,000 and $68,000 levels.
Note: Kryptomoney.com is not a financial advisor. Do your research before investing your funds in any financial asset or presented product or event. We are not responsible for your investing results
Image Credit: Shutterstock


Keep in mind that we may receive commissions when you click our links and make purchases. However, this does not impact our reviews and comparisons. We try our best to keep things fair and balanced, in order to help you make the best choice for you.
