
Bitcoin and the overall cryptocurrency market extended their devastating pullback after months of a sustained rally. The overall cryptocurrency market cap plunged below $1 trillion, against the nearly $2 trillion mark seen at the start of the year. Bitcoin (BTC) also pulled back from its $1 trillion market cap in the last few months, falling below $400 billion as of press time. BTC has been in the fall after its long-term sideways pattern broke to the downside, resulting in a new 18-month low of 20,071. The weekly BTC/USD has lost nearly 30% to confirm its entry into a full bear market supported by its moving averages (MA 50 & MA 200). Bitcoin also finished Thursday with a ninth consecutive day of losses, but now recuperates around its $20,000 historic zone and an all-time high of 2017. The BTC/USD upside bias remains weak after a technical bounce from its sudden collapse. As bearish pressure continues, Bitcoin mining profitability has plunged to an all-time low, per data from Cryptorank, an on-chain tracker. Due to the conditions, Bitcoin mining is no longer profitable. The market might witness a return of bullish activity as miners remain unwilling to sell their holdings at a loss.
Key Levels
Resistance Levels: $28,000, $25,000, $22,000
Support Levels: $20,000, $16,000, $12,000
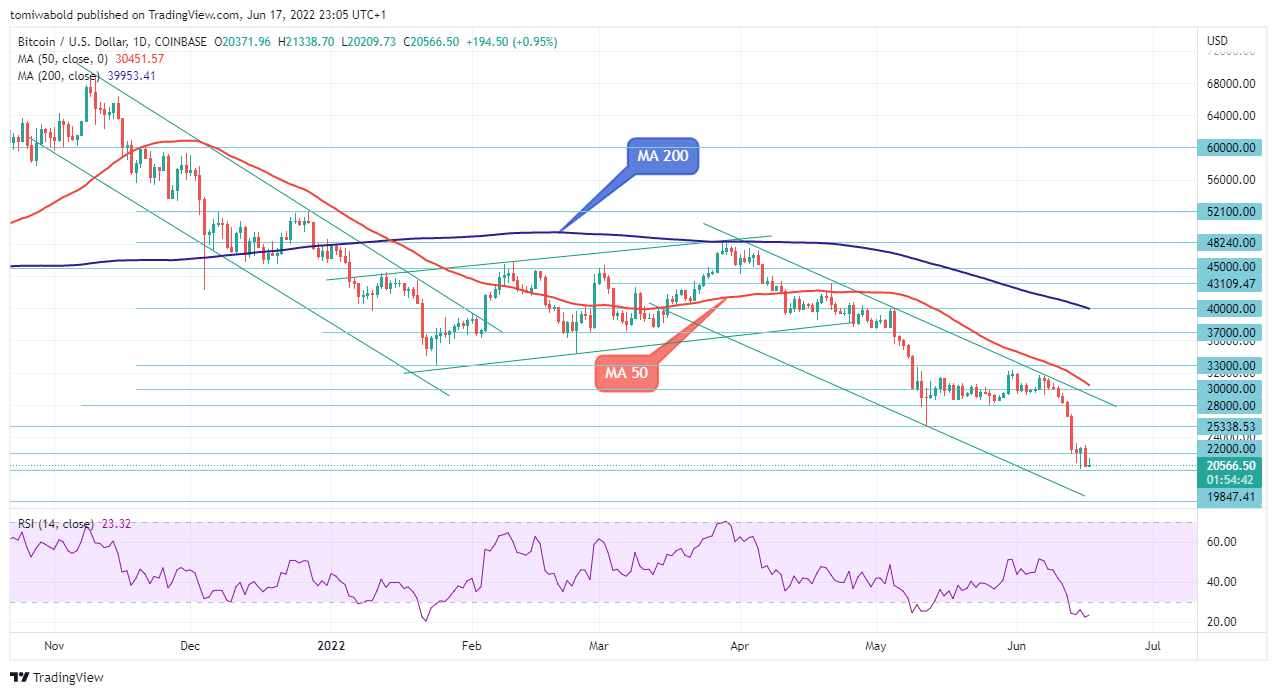 BTC/USD Daily Chart
The BTC/USD pair is still under a lot of pressure, but it appears to be reclaiming ground above the $20,000 level from earlier this week. In the near term, an extension of the fall is more plausible, as the pair remains undecided about its path after setting new 2022 lows at $20,071. The pair is mildly positive daily, and consolidation below the daily high of $21,338 could lay the ground for further losses.
If the daily exit is below the horizontal level of $22,000, the recent low at $20,071 could be probed. Following the collapse, the BTC/USD pair found support in the $20,000 price region, where it sustained above intraday lows today at $20,209. Before the year 2022 concludes, the pair might be exposed to historical levels between $16,000 and $10,000 or the positive if a rebound occurs at $40,000 or $69,000.
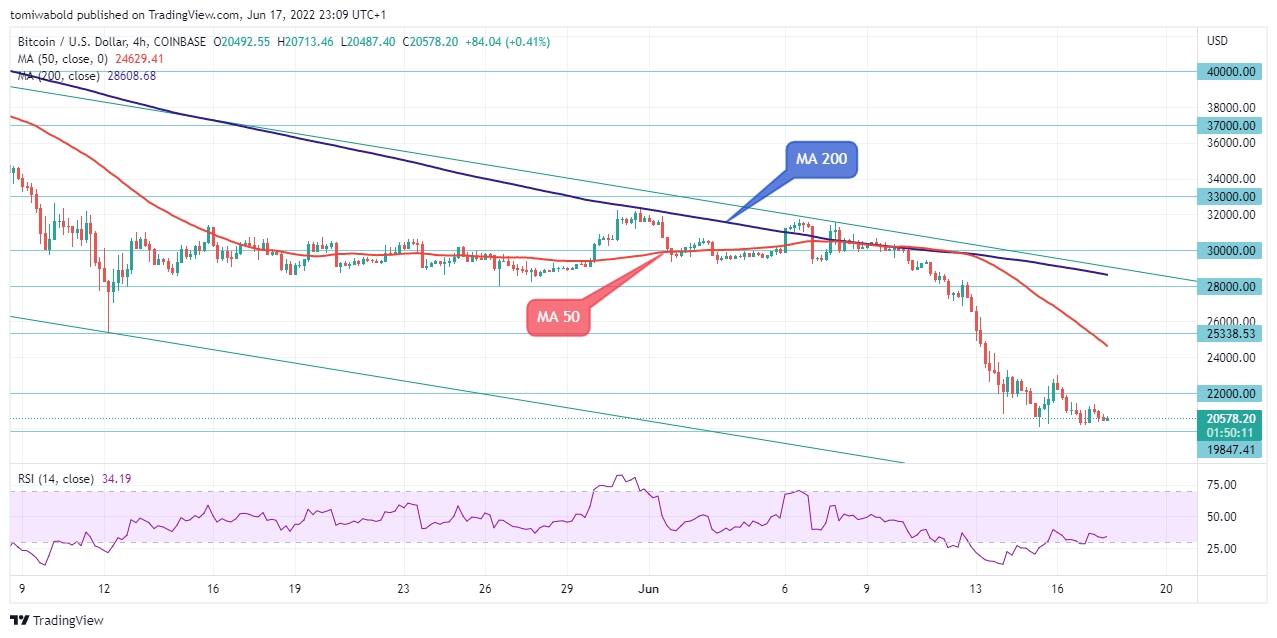 BTC/USD 4-Hour Chart
The BTC/USD remains in a bearish trend below the 4-hour moving average (MA 50) around the $24,500 level. If a higher rebound later occurs, a breakthrough of the support turned resistance level at $25,000 might confirm the scenario of a reversal from the $20,000 historical zone level ending above the 4-hour moving average (MA 50).
A breach of the 2017 all-time high of $20,000 and a test of $16,000 are possible outcomes if the price falls further. On the other hand, a limited breach of the $22,000 short-term barrier might accelerate its recovery into an extended consolidation, resulting in another round of drops within the $20,000 zone.
Note: Kryptomoney.com is not a financial advisor. Do your research before investing your funds in any financial asset or presented product or event. We are not responsible for your investing results
Image Credit: Shutterstock


Keep in mind that we may receive commissions when you click our links and make purchases. However, this does not impact our reviews and comparisons. We try our best to keep things fair and balanced, in order to help you make the best choice for you.