
Overall crypto markets anticipate additional price growth after a series of positive topics in the new US infrastructure bill raised expectations. The market’s focal points remain mixed with upward bias as the sessions roll in. After a two-month accumulation phase, buyers held support around $30,000, which eventually corrected to the upside. BTC reached a new 3-month high today and remains in its uptrend. The bullish cycle may persist till the outlook settles past $47,000. At the time of this post, the BTC/USD pair is currently trading at $46,473, marginally down from the week’s high of $46,781. It’s also a tad higher than both moving averages (MA 50 & MA 200). A bullish flag pattern appears to be building on the pair. As a result, the pair is expected to break out higher. Following Coinbase’s impressive quarterly profits, bitcoin and other cryptocurrencies held higher. The company generated revenue of about $2.23 billion, which was greater than the $1.78 billion median expectation, maintaining interests in Bitcoin.
Key Levels
Resistance Levels: $53,000, $50,000, $47,000
Support Levels: $45,000, $43,000, $40,000
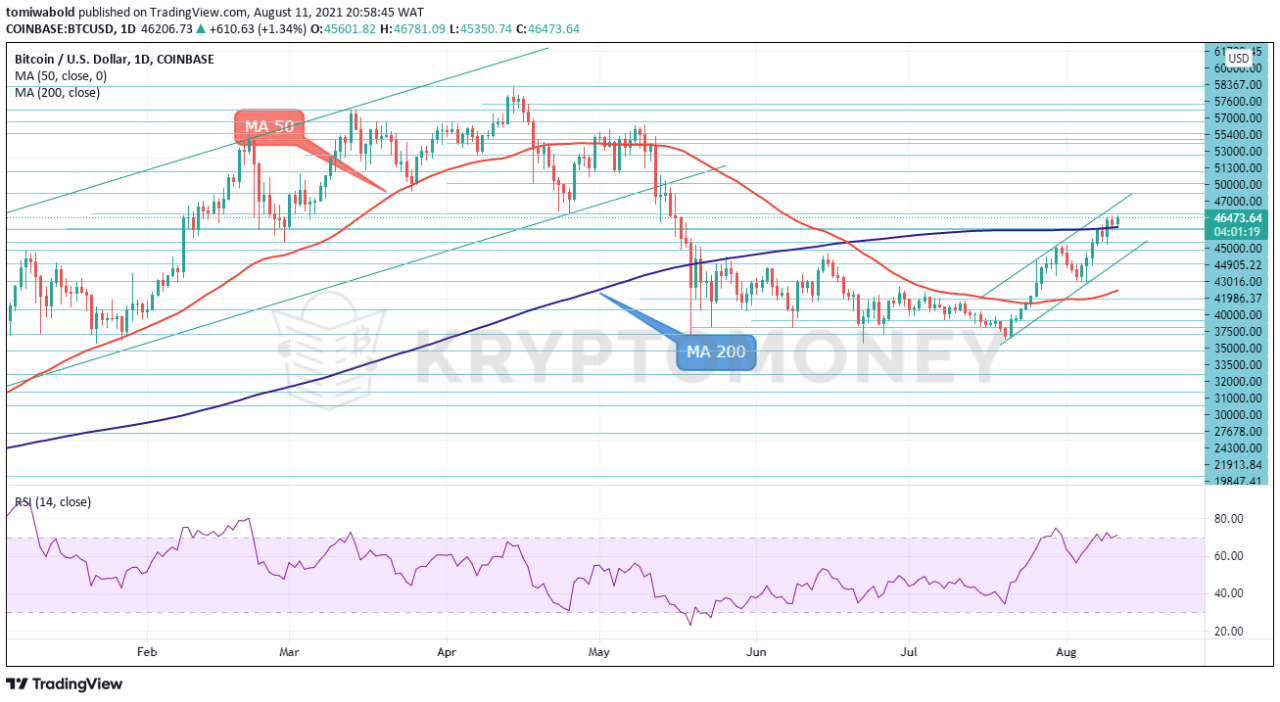 BTC/USD Daily Chart
In the prior day, the BTC/USD steadied at a firm base above $45,000 after flipping the moving average (MA 200) resistance into support, before drifting north to attempt the resistance region of $47,000 and peaking at a 3-month high of $46,781 on Tuesday. A rally higher could take the price past the $48,000 level, towards the psychological $50,000 level.
A drop below the moving average (MA 50), on the other hand, would lead back to the 3 months consolidation channel below the level of $43,000. Any break below this level would reinforce the negative pattern, putting the $40,000 round number into focus next. If the price continues to fall, it may reach the $37,500-$35,000 support zone.
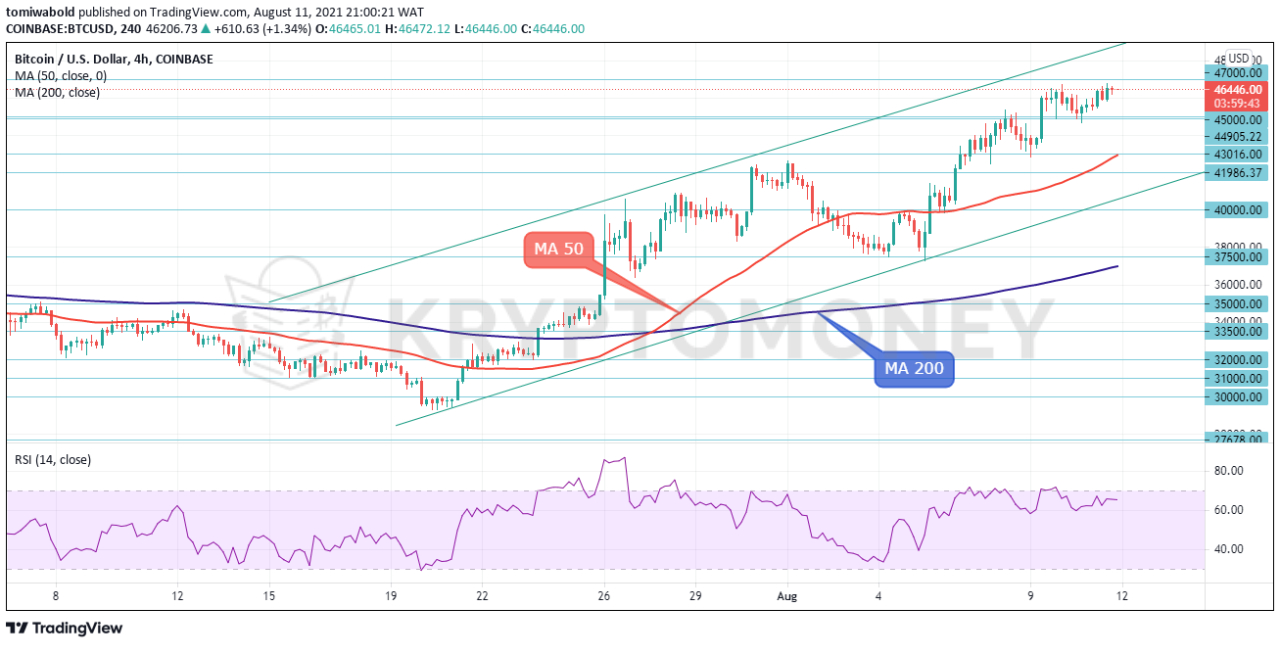 BTC/USD 4-Hour Chart
The 4-hour time frame offers more clarity as the BTC/USD exchange rate is currently trading around the upper threshold of an ascending channel pattern, suggesting that a breakout is imminent. If the breakout occurs, this session might see a push past the resistance level of $47,000 into the $48,000 region.
If the channel pattern continues, however, the currency exchange rate will continue to fall within the ascending channel throughout the next trading session. If selling forces resurface, the pair may seek support before its short-term moving averages (MA 50), which is now near $43,000. Steeper decreases could take the price until the $40,000 support zone.
Note: Kryptomoney.com is not a financial advisor. Do your research before investing your funds in any financial asset or presented product or event. We are not responsible for your investing results
Image Credit: Shutterstock


Keep in mind that we may receive commissions when you click our links and make purchases. However, this does not impact our reviews and comparisons. We try our best to keep things fair and balanced, in order to help you make the best choice for you.
