
Following a disastrous week that saw Bitcoin plummet from around $53,000 to $42,830, the lead crypto has managed to reclaim its positive pattern. Meanwhile, BTC investors will be watching for a critical lower high above the $48,000 range, which would confirm $53,000 as a short to medium-term top, with downside targets emerging below $43,000. However, September is historically a difficult month for the crypto markets. Investors’ expectations that a correction is coming also add to the uncertainty. However, institutional adoption has kept BTC prices stable. BTC/USD price back above the moving averages (MA 50 and MA 200) on the daily chart indicates an impending positive major rally for the pair. At the time of writing, BTC/USD trades at $48,005. BTC options worth $810 million will expire this Friday, and derivatives data implies bulls are eager to push the price past $50,000. Since 88 percent of the $310 million put (sell) options have been placed at $47,000 or lower, the expiry will be a test for bears. As a result, if BTC trades above that price, the open interest in the neutral-to-bearish put option will drop to just $36 million.
Key Levels
Resistance Levels: $55,000, $53,000, $50,000
Support Levels: $47,000, $45,000, $43,000
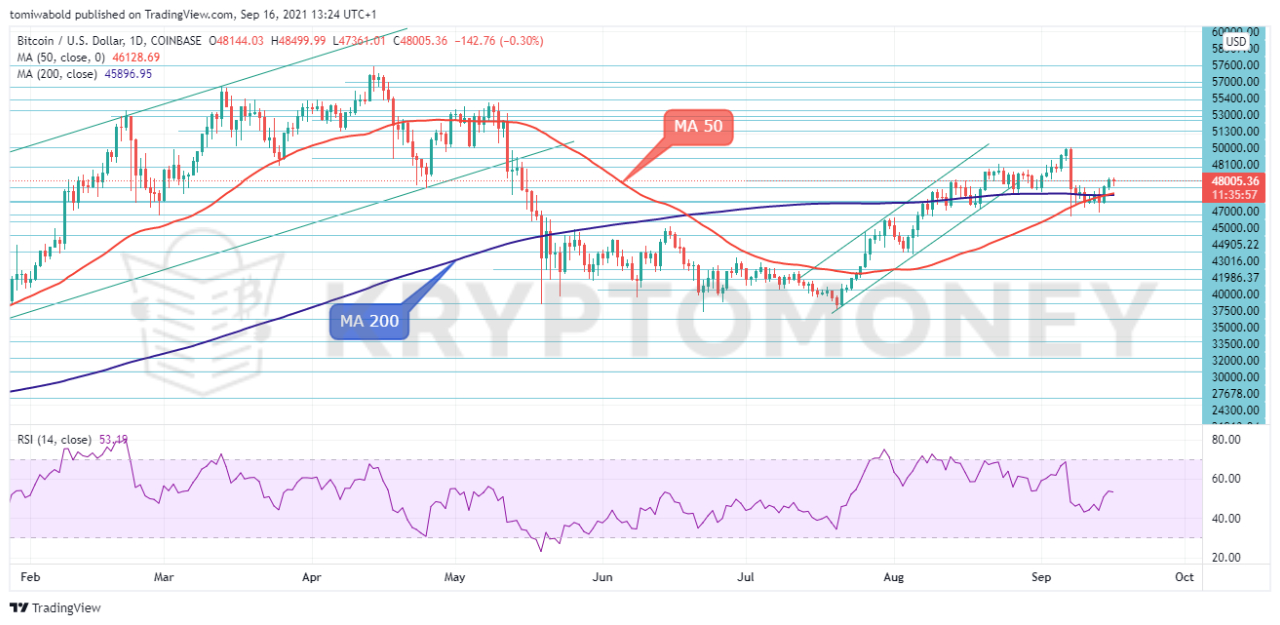 BTC/USD Daily Chart
The most likely scenario is for the bulls to retest the $53,000 high after staying confined inside and beneath the daily moving averages (MA 50 and MA 200) in preceding months. BTC prices have finally exited and now ventures outside its technical limitations where it’s poised to be a tight one, with potentially significant market implications.
Depending on the outcome around its psychological $50,000 resistance, BTC rates could easily retrace the recent rally and fall back below $45,000 to resume the downtrend correction later this month. In the positive, bullish triggers above the $50,000 threshold may activate for a run towards the $55,000 area where investors may book profits before further attempts.
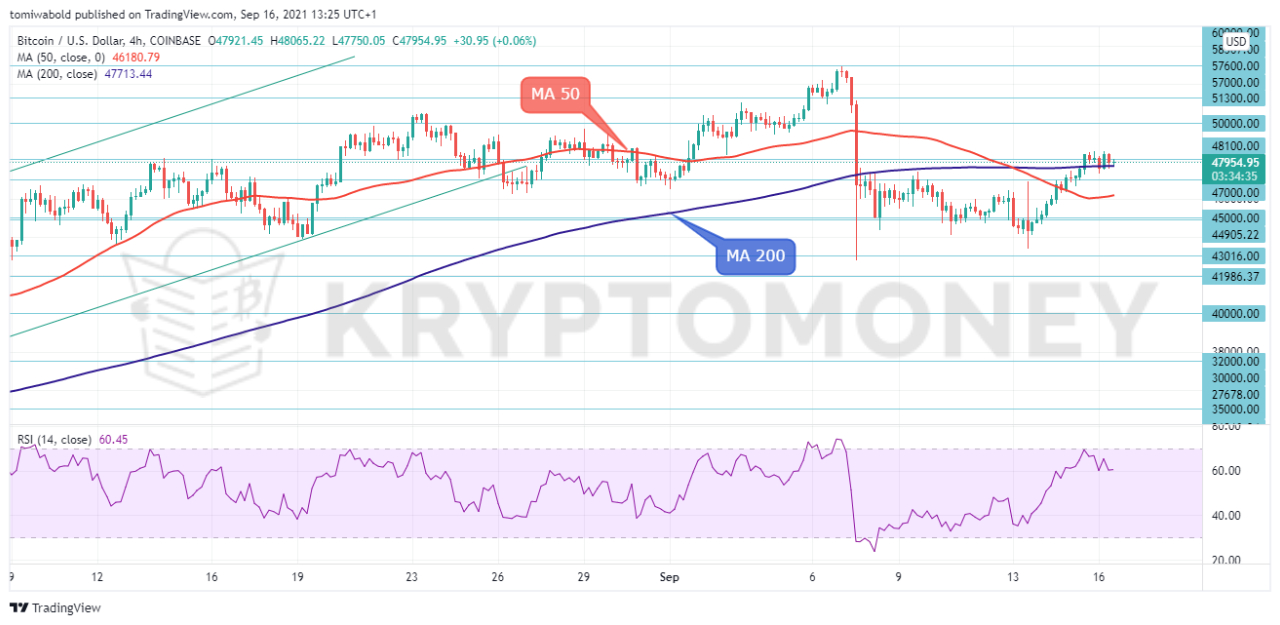 BTC/USD 4-Hour Chart
BTC gained ground and broke over the 4-hour moving average (MA 200) at $47,000, reaching the $48,499 intraday high-level today. The lead crypto could not hold on to its gains as the upside drive off the $48,000 level seems to have run out of fuel near the upper boundary. If the decline continues, it would most likely look for support at $47,000 and MA 50 around $46,000.
The moving average (MA 200) feeds the bullish structure even though sellers are making a stand. The short-term oscillators reflect a slight weakness in bullish forces. The moving average (MA 50) strengthens its position in the positive zone, while the relative strength index (RSI) is marginally faltering in bullish territory. On the other hand, a potential recovery would first test the resistance at $50,000.
Note: Kryptomoney.com is not a financial advisor. Do your research before investing your funds in any financial asset or presented product or event. We are not responsible for your investing results
Image Credit: Shutterstock


Keep in mind that we may receive commissions when you click our links and make purchases. However, this does not impact our reviews and comparisons. We try our best to keep things fair and balanced, in order to help you make the best choice for you.
