The price of Bitcoin is regaining upside traction, showing strength and climbing quite comfortably while the Altcoin segment, mainly the ETH is struggling to keep up. BTC price had dropped from $12,000 to $10,000 earlier in the month. A bullish confluence has begun to form beyond the $10,500 psychological price zone. After showing weakness during its corrective phase, bulls are poised to flip the $11k barrier on BTC/USD. The Bitcoin (BTC) market cap is currently $203 billion, with $31.68 billion traded in the past 24 hours. BTC/USD has gone up from a low of $10,662 to register an intraday high of $11,099. Bitcoin is trading at $11,021 at press time and it’s up over 150% from March 2020 lows. The Bitcoin market dominance upticks more than 1% and now accounts for 58.1% of the market share. After an optimal set-up back at the top of the market, the decline of most of the Altcoins has positively affected Bitcoin (BTC) price by keeping it in the green zone.
*A bullish confluence has begun to form beyond the $10,500 psychological price zone
*After showing weakness during its corrective phase, bulls are poised to flip the $11k barrier on BTC/USD
*The Bitcoin market dominance upticks by 1% and now accounts for 55.1% of the market share
Key Levels
Resistance Levels: $12,500, $12,000, $11,500
Support Levels: $10,500, $10,000, $9,500
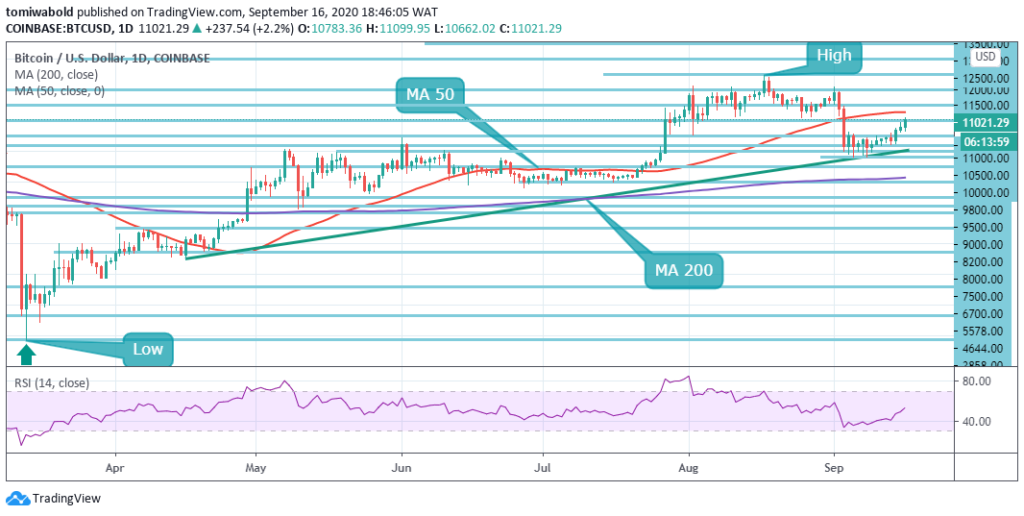
 BTC/USD Daily Chart
Bitcoin (BTC) is a strong “buy” as per a range of chart indicators that are flashing bullish this week. The RSI adds to the overall positive impression being given by Bitcoin’s technicals while emerging past its midline on the daily chart. The analysis of BTC price convergence zones indicates the way to the south is cluttered with numerous support levels.
As BTC/USD attempts to flip the $11,000, the price may be in for massive volatility ahead of the limiting MA 50 at $11,300. This area served as strong support for most of August. Now BTC may retest it as resistance and may reverse back to $10,500. Above the $11,000 price, the first key resistance level is at $11,500, then the second at $12,000 and the third one at $12,500.
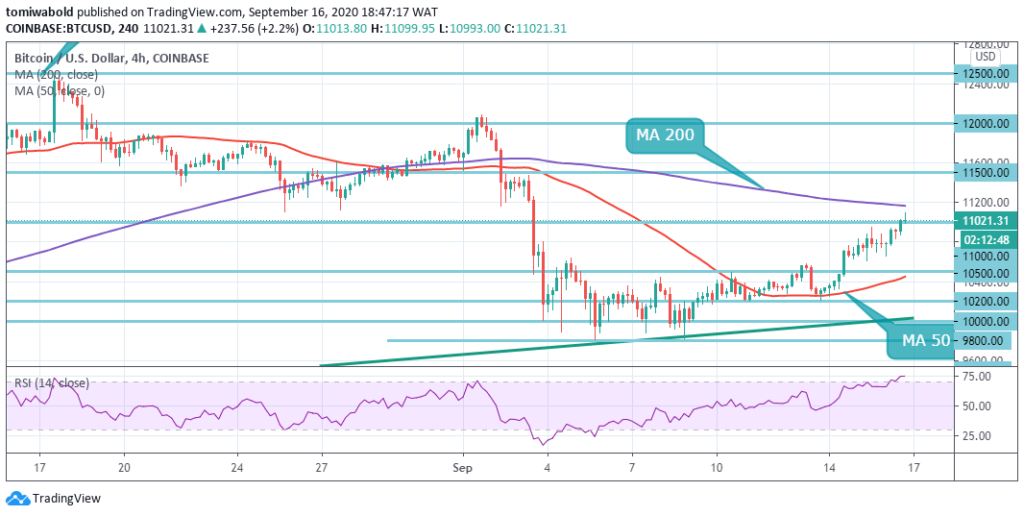
 BTC/USD 4-Hour Chart
Bitcoin has started to correct higher after bulls successfully forced a breakout above the technically important $11,000 resistance level. The task is to flip the barrier into a credible short term support zone as it picks up traction. Alternatively, traders that are bullish towards the BTC/USD pair may wait for a pullback towards the $10,500 area to attempt long positions.
Technical analysis highlights that bulls need to close above the 4 hours MA 200 at $11,200 level for further upside advancement. The BTC/USD pair is only bullish while trading above the $11,000 level, key resistance is found at the $11,500 and the $12,500 levels. If the BTC/USD pair trades below the $11,000 level, sellers may test the $10,500 and $10,200 levels.
Note: Kryptomoney.com is not a financial advisor. Do your research before investing your funds in any financial asset or presented product or event. We are not responsible for your investing results
Image Credit: Shutterstock
Keep in mind that we may receive commissions when you click our links and make purchases. However, this does not impact our reviews and comparisons. We try our best to keep things fair and balanced, in order to help you make the best choice for you.