
Bitcoin is facing a brief sell-off after a spike that saw it climb past $45,000 on Feb. 8. The overall cryptocurrency market had posted a strong rally, boosted by gains in the technology sector following the roller coaster week that ended on a positive note for Bitcoin above $40,000. Despite the rally, BTC/USD remains very mixed at $43,362 and is up on the day at 11% at the time of this post. The spectacular climb saw BTC rise to hit an intraday high of $45,519. Investors expect the U.S Fed to maintain its aggressive stance on inflation, and analysts are projecting a 100% probability that the Fed will raise rates in March. BTC is not out of the woods yet and might face more headwinds again if pressure on the tech sector increases. “Open interest in futures and the number of exchange balances indicate less panic or liquidation of positions than in May,” per the latest JPMorgan study, “particularly to significant crypto investors.” Given the recent BTC price rebound, the Crypto Fear and Greed Index has become less negative at “fear” has spent most of January in “extreme fear” territory.
Key Levels
Resistance Levels: $50,000, $47,000, $45,000
Support Levels: $42,000, $40,000, $37,500
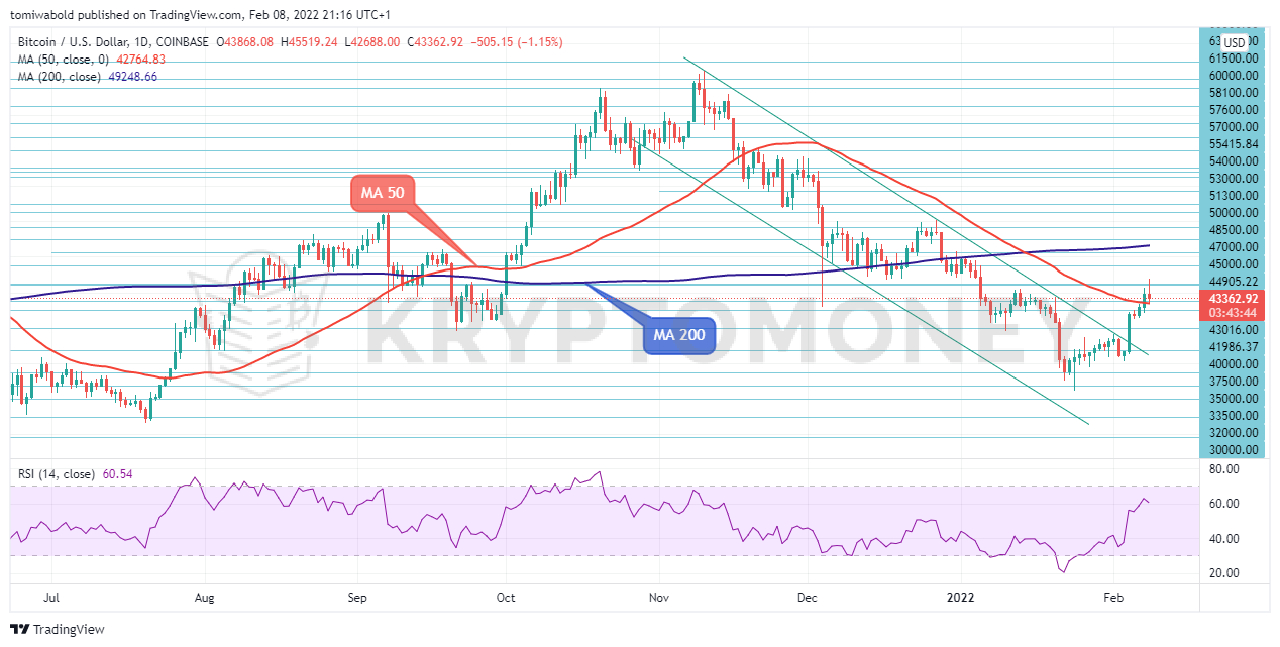 BTC/USD Daily Chart
The Bitcoin daily chart is showing a mixed trend. BTC/USD surged above the moving average (MA 50), and tested above the mid-January pivot area breaking the $45,000 barrier. At the same time, the relative strength index (RSI) on the daily charts has not yet reached overbought territory, indicating that there is still room for more increase towards $50,000.
However, the BTC/USD pair is facing headwinds below the $45,000 trough while reflecting a slight weakening in the positive momentum. In the negative scenario, downside limitations could come from the immediate barrier of $42,500, encompassing the flattening moving average (MA 50). Beneath this obstacle is the $42,000 level, which might be a footing for buyers to capitalize on.
 BTC/USD 4-Hour Chart
BTC/USD has broken above the short-term moving averages (MA 50 and MA 200) and now the pair shows a higher high bullish sequence from Jan. 24, 2022 low. Its near-term pullback should find support around MA 50 and swing for further upside as far as its support at $40,000 stays intact. If the market stays uncertain, $37,500 is the next level of support.
If it is breached, the correction might be extended back to $33,000. The recent rebound hit resistance near $45,519. BTC/USD short-term narrowing consolidation and higher highs suggest increased buying pressure. A bullish breakout would drive out sellers and draw momentum traders, increasing volatility. This would be a solid continuing indication for the bulls.
Note: Kryptomoney.com is not a financial advisor. Do your research before investing your funds in any financial asset or presented product or event. We are not responsible for your investing results
Image Credit: Shutterstock


Keep in mind that we may receive commissions when you click our links and make purchases. However, this does not impact our reviews and comparisons. We try our best to keep things fair and balanced, in order to help you make the best choice for you.

