
Over the last 3 days, BTC/USD has been stuck in a narrow range while changing hands at $6,600. The Crypto King has largely remained steady daily and has declined around 1% since the start of Friday. While the heat map suggests that cryptocurrencies have risen in value in the last 24 hours, Bitcoin’s response to the current financial market turmoil was expected to act as a safe-haven, but instead fell along with equities and other risky assets. Bulls are currently constrained beneath the $7,000 price level while attempting to seize the price increase drive, yet momentum is not matched by an increase in trading volume. Bitcoin’s Hashrate has plunged 45 percent after hitting an all-time high of 136 exahash per second (EH/s) and has since fallen to 75 EH/s. The fall emerged from the impending economic turmoil that is tormenting the entire globe, causing several miners to shut down their operations.
*BTC/USD has been stuck in a narrow range over the last 3 days while changing hands at $6,600
*Bulls are constrained beneath the $7,000 price level
*Bitcoin’s Hashrate has plunged 45 percent after hitting an all-time high
Key Levels
Resistance Levels: $8,500, $7,700, $7,000
Support Levels: $6,400, $6,000, $5578
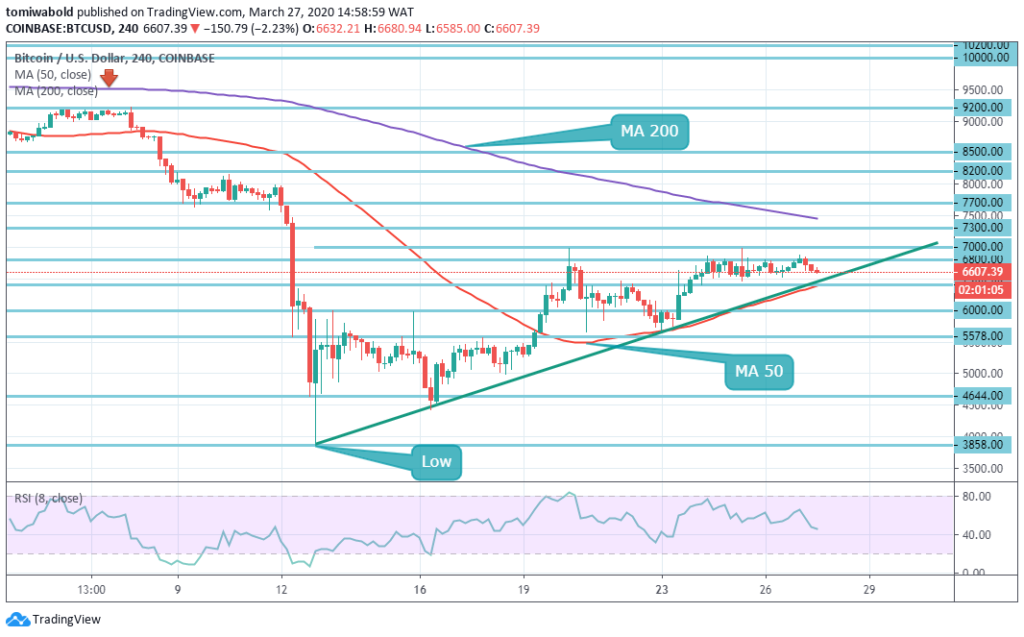
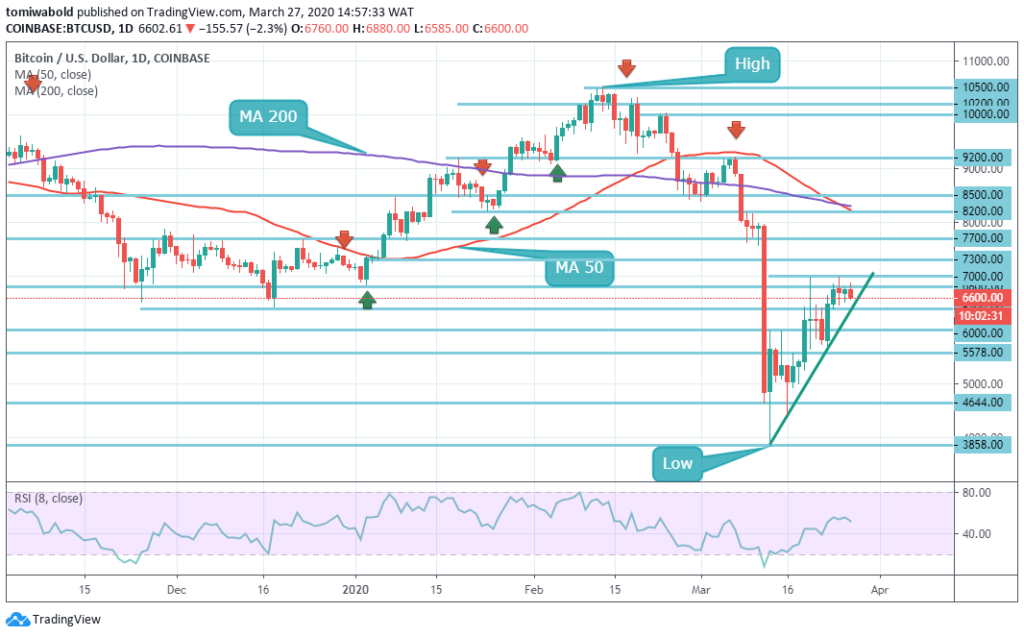 On the upside, the bulls are constrained beneath $7,000 price level at the moment, with the intraday high just below here. Once it’s out of the path, the upside is likely to regain momentum, with the next target pushing past $7,000 level. These constraints halt the progress throughout this week and may function as a reversal level during the next bullish surge. A rather more realistic shift may put the $7,300 level and the $7,700 psychological level back to view.
At the downside, near term support is $6,400 level. It is the lower boundary of the recent consolidation channel supported by the formation of a trend line. When it is broken, the sell-off may gather momentum and push the price to $6,000 and $5,578 price levels.
 Bitcoin is trading 1% lower on Friday, and the market is unusually silent. The candles are alarmingly low, and anything may occur before the volatile movements. The chart above suggests the $7,000 level tends to be a major obstacle for the bulls. It’s been tried a few times already, and every time the bulls near the price the bears set in again.
On the positive hand, the price is still above 50 MA, which is usually a bullish signal. There is also a trend line of support but if it falls, it may suggest more bearishness. The RSI indicator is over the 50 mid-line, which is bullish, but it’s heading down so there’s a risk of a break here. At the moment, BTC is stuck in a narrow range with a short-term neutral bias in the midst of decreasing volatility.
Note: Kryptomoney.com is not a financial advisor. Do your research before investing your funds in any financial asset or presented product or event. We are not responsible for your investing results
Image Credit: Shutterstock


Keep in mind that we may receive commissions when you click our links and make purchases. However, this does not impact our reviews and comparisons. We try our best to keep things fair and balanced, in order to help you make the best choice for you.