
The cryptocurrency market is set to finish the month strong after the positive earnings season and the increase in interest rates by the U.S. Federal Reserve (Fed) appears to be the main driver of the bullish trend. In the near term, Bitcoin is still rising as the cryptocurrency market points to further potential gains as general optimism is likely to continue into the weekend. After a major bullish signal seen on July 26 on the BTC/USD daily chart, the bulls have gained traction for the 3rd day in a row. BTC is now on the verge of flipping the $24,000 level into support since reaching daily highs of $24,450. At the time of this analysis, the BTC/USD pair is trading at $23,865. According to data provided by McGlone, BTC’s price 250-day volatility relative to the Bloomberg Commodity Spot Index has decreased. The price of Bitcoin moves in the opposite direction whenever this statistic declines.
Key Levels
Resistance Level: $30,000, $28,000, $25,000
Support Levels: $22,000, $20,000, $17,000
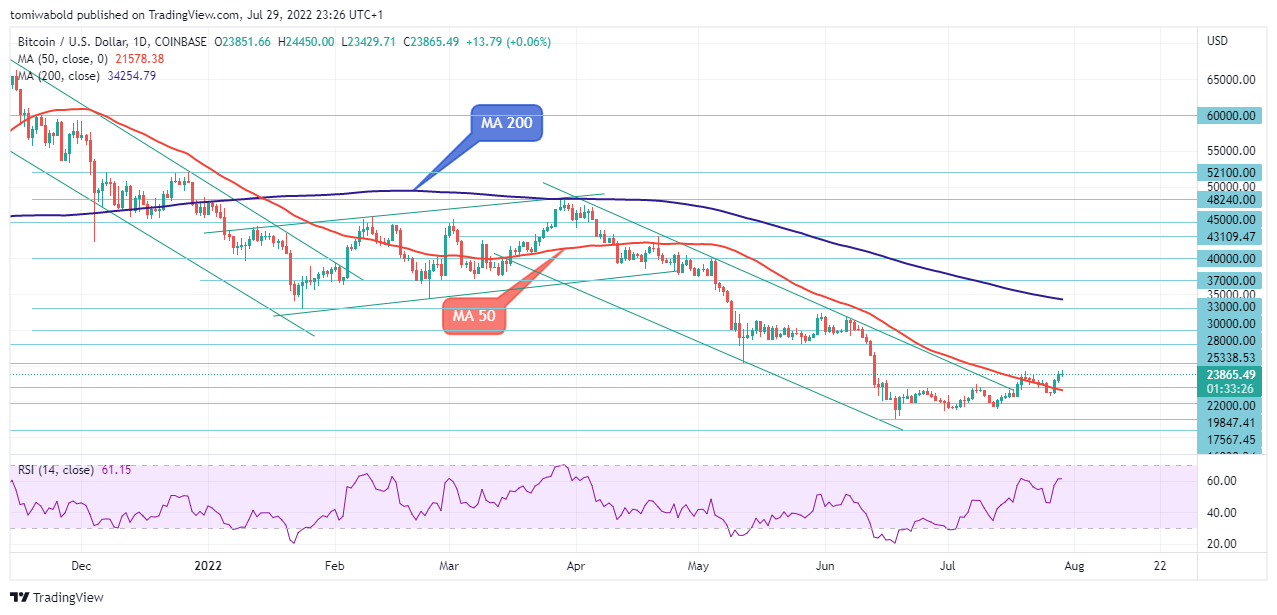 BTC/USD Daily Chart
In relation to the US dollar, BTC began a new wave of rebound above the $20,500 area after a hammer candlestick flashed a bullish signal. Although it encountered sellers, the BTC/USD pair rose over the daily moving average (MA 50) and $22,000 resistance.
At the $24,500 area, the pair is losing momentum and is currently consolidating. The pair has, however, stabilized above both the daily moving average (MA 50) and the $22,000 level. The next horizontal barrier is near the immediate upward resistance at $25,338.
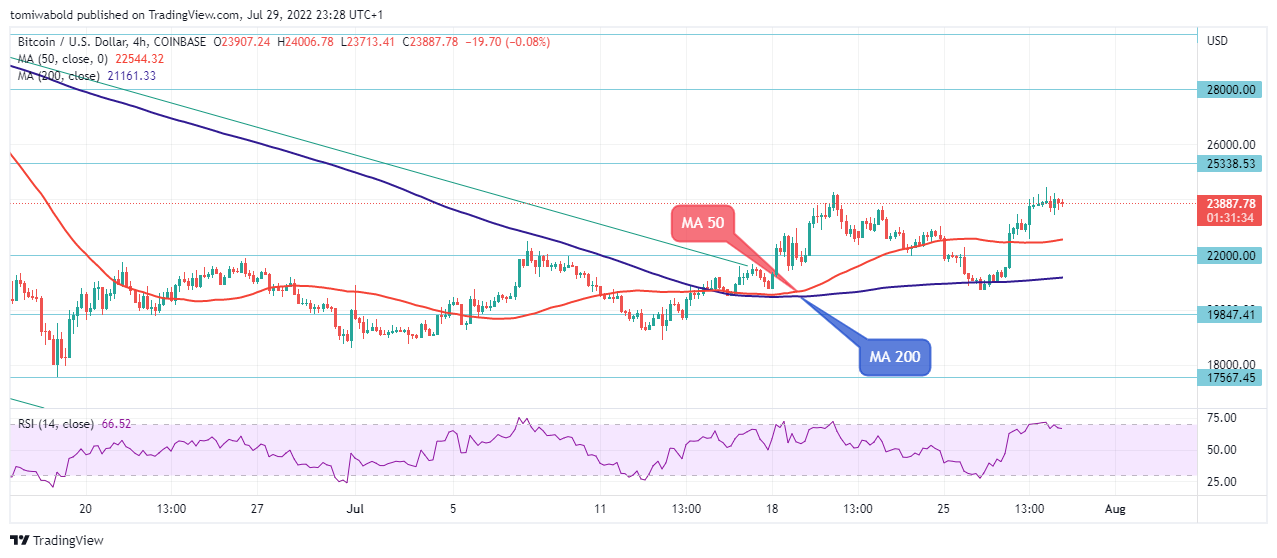 BTC/USD 4-Hour Chart
On the 4-hour chart, the first significant obstacle on the upside is located close to the $25,000 mark. A decent recovery wave may begin with a break over the resistance levels of $25,338 and $28,000. It may even exceed $30,000 in the aforementioned scenario.
If not, the pair may decline under $22,000 and the 4-hour moving average (MA 50). The 4-hour MA 200 is the next important support at $20,000; below this level, the pair may slide in the near future toward the $17,000 level in a bearish mode. Any more gains might push the pair above the $25,000 level.
Note: Kryptomoney.com is not a financial advisor. Do your research before investing your funds in any financial asset or presented product or event. We are not responsible for your investing results
Image Credit: Shutterstock


Keep in mind that we may receive commissions when you click our links and make purchases. However, this does not impact our reviews and comparisons. We try our best to keep things fair and balanced, in order to help you make the best choice for you.