
Bitcoin soars despite the fact that Ethereum is gaining traction following the London Hard Fork as nothing compares to BTC’s finite 21 million coins. The price of Bitcoin soared above $43,000 for the first time since mid-May towards the close of the week. With a massive comeback, BTC has clawed its way back from the edge of bear market confirmation to challenge key resistance zones. BTC/USD jumped dramatically to $43,399 on Friday as investors reacted to news of the crypto industry’s Mainstreaming. The US Senate is to vote on an infrastructure bill that includes tax-reporting “revenue” requirements that might have disastrous consequences for cryptocurrency products and services. The crypto clause in the infrastructure bill has the industry racing to lobby for amendment, with officials having to listen as the opposition grows. Supporters in the US Senate offered clarity that miners and suppliers of crypto services would not be obliged to follow proposed US tax-reporting standards that apply to crypto brokers.
Key Levels
Resistance Levels: $50,000, $47,000, $45,000
Support Levels: $40,000, $37,500, $35,000
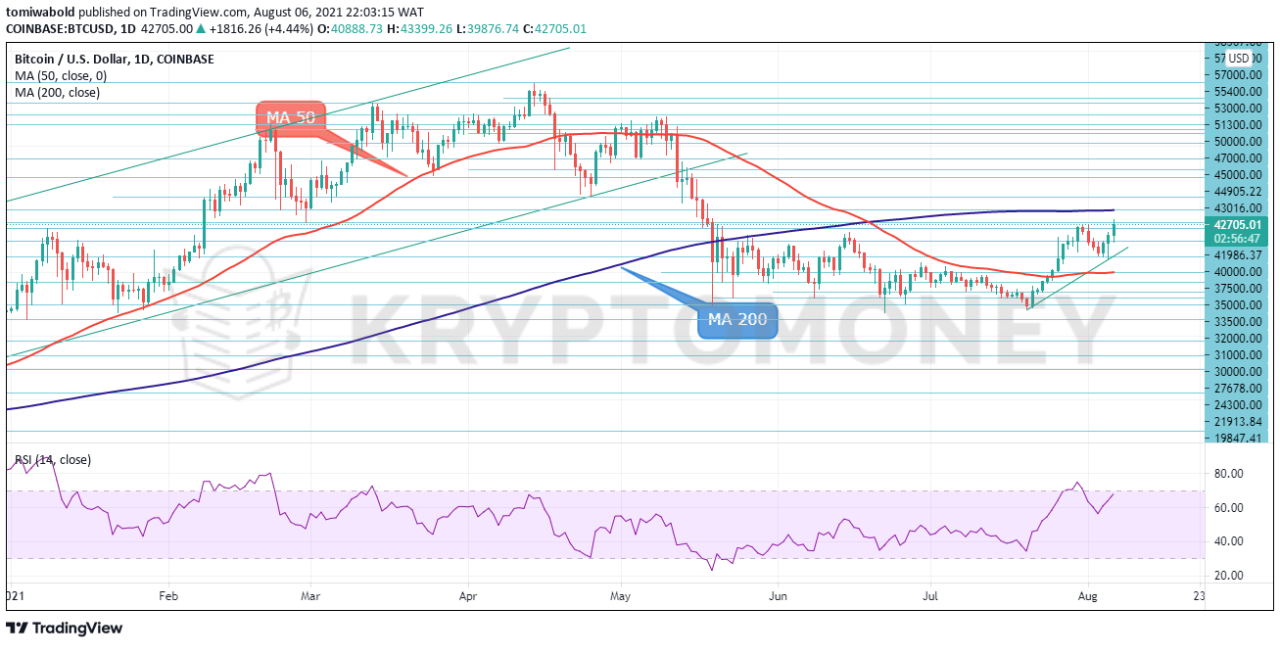 BTC/USD Daily Chart
On Friday, Bitcoin underwent a stunning short squeeze, soaring from $39,876 to as high as $43,399 in a matter of hours. BTC/USD is trading at $42,705 at the time of writing, confirming a breakout above resistance zones of $42,000 and $42,500. In the immediate term, Bitcoin faces the dreaded daily moving average (MA 200) at $45,000, which hasn’t been tested since the grueling death cross on June 21.
A daily close above the $45,000 level would imply a period of continuance for BTC, however, it’s worth noting that a pullback to re-test the moving average (MA 50) on the $35,000 level of resistance as support would be the likely technical route for the bears to take. Bitcoin is projected to retrace a part of its advance if it drops below $40,000, with downside targets of $37,500 and $35,000 looming.
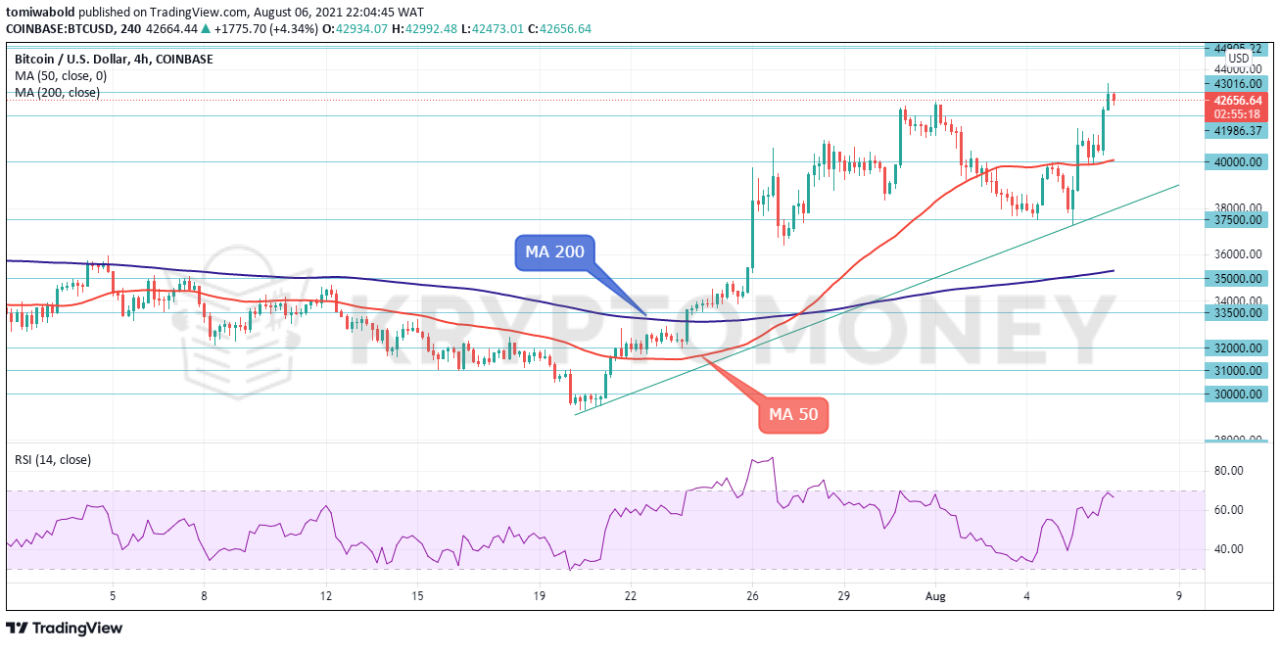 BTC/USD 4-Hour Chart
The BTC/USD pair has broken out to the top of its range on the 4-hour chart. It is currently trading near $43,000. The short-term moving average (MA 50) will act as a backstop in the event of a mild pullback with relative strength index (RSI) producing a bullish oscillation. BTC price is close to critical resistance at $45,000. As a result, a break-over will signal a strong bullish trend.
The expected downturn hasn’t gained much traction, and important levels remain below, suggesting that subsequent negative swings are more likely to be corrective than anything more major. After breaking over the $43,000 resistance area, the pair will most likely begin to climb towards the $45,000 level, as per the most likely scenario. Alternatively, the pair may make a final correction back to the $40,000 support level before rallying past the $45,000 resistance level.
Note: Kryptomoney.com is not a financial advisor. Do your research before investing your funds in any financial asset or presented product or event. We are not responsible for your investing results
Image Credit: Shutterstock


Keep in mind that we may receive commissions when you click our links and make purchases. However, this does not impact our reviews and comparisons. We try our best to keep things fair and balanced, in order to help you make the best choice for you.