
The cryptocurrency markets have shed enormous value across the board after stalling a price rally driven by fears of the US dollar debasement and higher inflation. Bitcoin price is on the edge of the collapse of a wide bearish correction that may probably bring to effect one more bullish surge. Despite its recent surge, bulls pullback after BTC/USD prints a $19,500 multi-year high. The lead crypto BTC plunged under $17,000 and revisited $16,200, dropping over 15% of its price from the recent $19,500 high in few hours. The Bitcoin (BTC) market cap is currently $318 billion, with $61.03 billion traded in the past 24 hours. BTC/USD traversed the sub $17,000 region at press time following a moderate rebound from local lows. The Bitcoin price is heading for a drastic retracement, considering the bearish symptoms seen during this rally. The swift price collapse came following the transfer of Bitcoin to exchanges by Whales, probably to make gains around the all-time highs of Bitcoin near $20,000.
*Despite its recent surge, bulls pullback after BTC/USD prints $19,500 multi-year high
*The lead crypto BTC plunged under $17,000 and revisited $16,200
*The swift price collapse came following the transfer of Bitcoin to exchanges by Whales
Key Levels
Resistance Levels: $20,000, $18,500, $17,000
Support Levels: $16,000, $14,500, $13,000
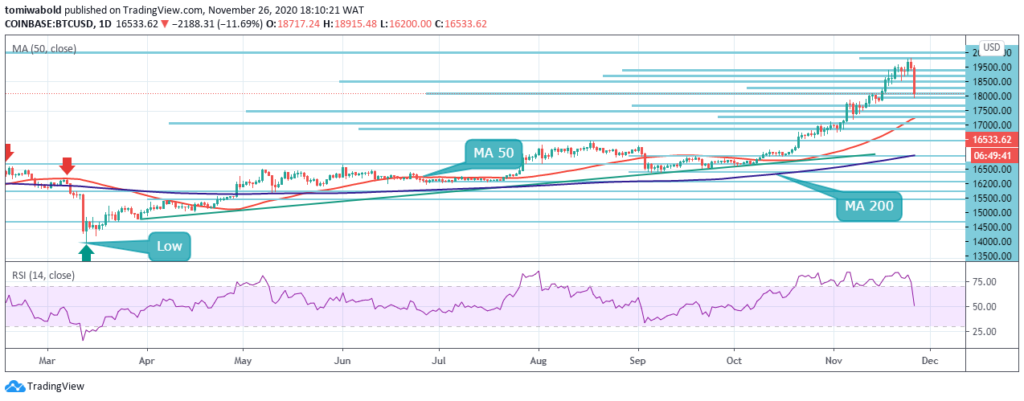 BTC/USD Daily Chart
On the daily chart, Bitcoin (BTC) has been trading within an upswing price channel past MA 50, lifting from $13,500 since the beginning of November. Its price is yet to surpass its all-time high of $20,000, which means the rising potential remains. From a technical perspective, BTC/USD traded in overbought territory at $19,500 hence the retracement.
With the downside correction activated, BTC is under intense headwinds with losses extending below the critical support levels on the daily chart. The breakdown is on its path to find support and losses have stretched to a weekly low of $16,200. The bearish pattern formed by the Relative Strength Index also validated the downtrend. If the bulls resume active action, BTC may return to the zone of the annual high and test the $20k mark.
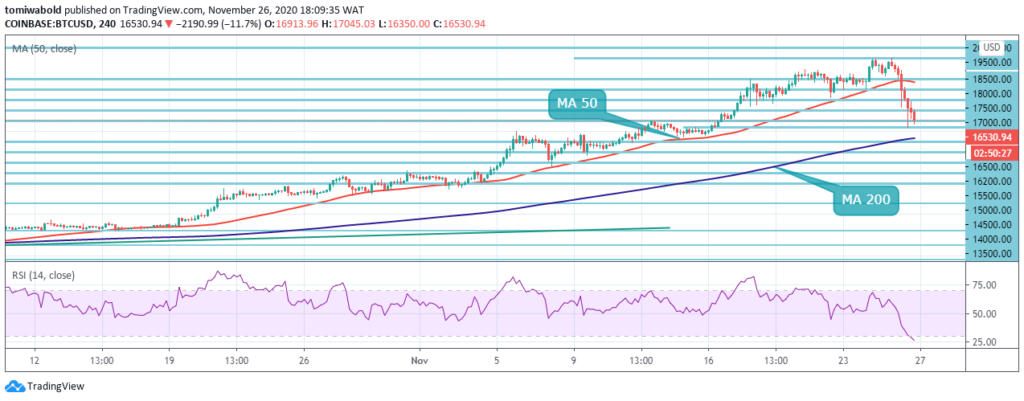 BTC/USD 4-Hour Chart
Bitcoin has incurred a heavy technical sell-off on the 4-hour chart after the lead crypto plunged under $17,000 and revisited $16,200, dropping over 15% of its price from the recent $19,500 high in few hours. Technical analysis indicates that a head and shoulders pattern may evolve, with the neckline of the bearish pattern located around the $17,500 level.
Traders that are bearish towards the BTC/USD pair may attempt to sell into recovery around the $15,500 area around the 4 hour MA 200. To the upside, continued gains above the $17,000 level could see the BTC/USD rallying back towards the 4 hour MA 50 and $18,500 resistance level. If the BTC/USD pair exchanges beneath the $17,500 level, sellers may test the $16,000 and $15,500 levels.
Note: Kryptomoney.com is not a financial advisor. Do your research before investing your funds in any financial asset or presented product or event. We are not responsible for your investing results
Image Credit: Shutterstock


Keep in mind that we may receive commissions when you click our links and make purchases. However, this does not impact our reviews and comparisons. We try our best to keep things fair and balanced, in order to help you make the best choice for you.
