
Bitcoin (BTC) saw a heavy retracement after trying (but failing) to break above the $43,000 mark in the prior week on worsening risk sentiment and outflow of funds from short-term holder addresses. BTC faced headwinds from the strong moving average (MA 50) resistance zone at $42,000. The bulls came under pressure as the price fell below $40,000 to reach an intraday low of $37,700 on April 26. At the time of analysis, BTC/USD rebounded off lows to trade at $39,370 with a nearly 2% gain in 24 hours. Per glassnode data, the number of active addresses on the Bitcoin network has dropped to 15.6 million, about 30% less than the January 2021 high. However, per Santiment data, the market has been supported by long-term holders and recent whale accumulations of more than 40,000 BTC worth $1.6 billion from the recent dip. Following a six-week low, Bitcoin (BTC) has rebounded and might continue in the near term.
Key Levels
Resistance Levels: $45,000, $42,000, $40,000
Support Levels: $37,000, $35,000, $33,000
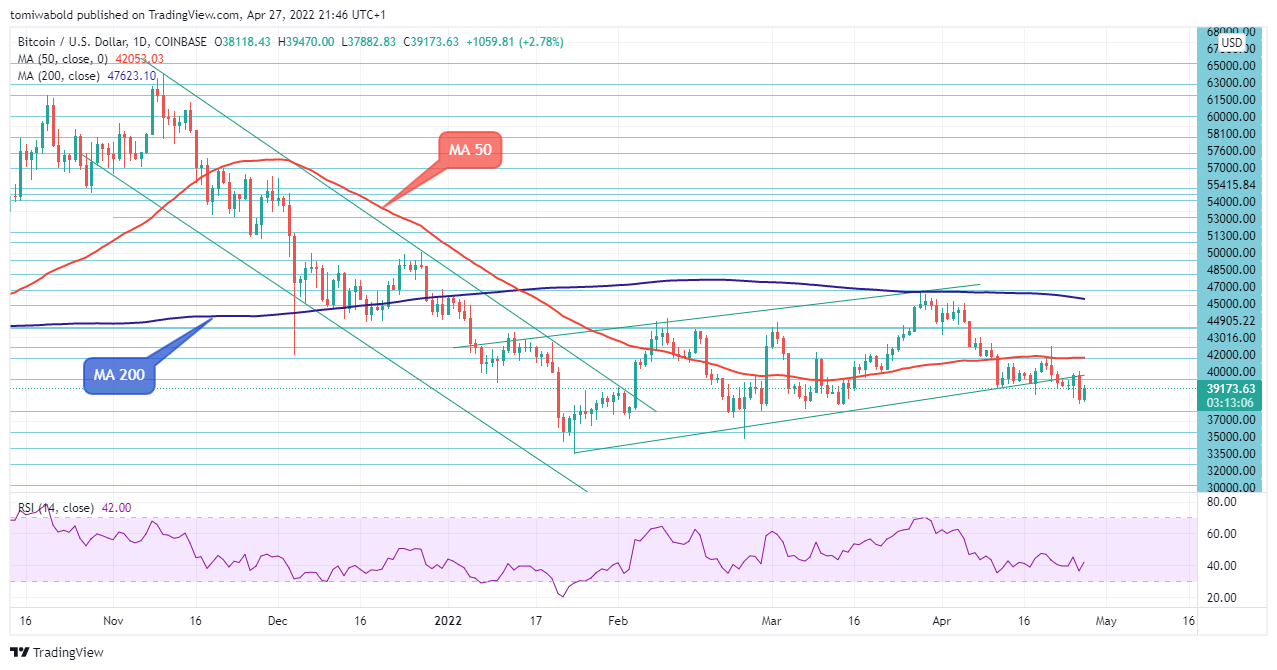 BTC/USD Daily Chart
Since striking a recent low of $37,700, BTC buyers have dominated the daily chart, steering the price towards the horizontal barrier of $40,000. The rebound setting supports the action that is putting pressure on the $39,000/40,000 zone, a breach of which might lift bulls even more.
If sellers emerge, an initial support zone between $38,000 and the horizontal support zone at $37,000 could form. If the price breaks above $40,000, the test of the moving average (MA 50) barrier and resistance section of $42,000-$43,000 might speed up. On the other hand, both the buyers and the sellers are in command, and no sign of weakness is seen on each side.
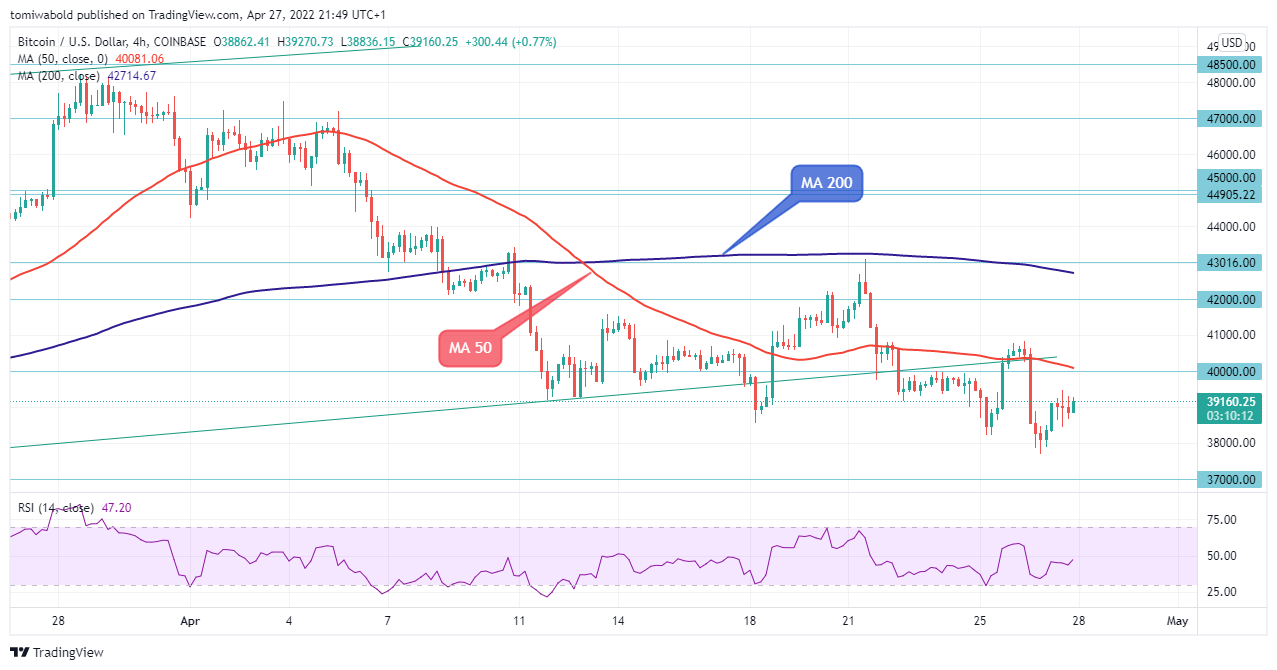 BTC/USD 4-Hour Chart
The short-term outlook remains in a range, as the pair continues to trade sideways, edging closer to the $40,000 level, with mild bullish technicals backing the scenario. Bulls might consolidate if rejection occurs at the important $40,000 zone, with the Relative Strength Index (RSI) above its midline 50, before launching a new attack towards $42,000.
Although dips should retain support to sustain the bullish near-term structure off the recent lows of the April 26 collapse in preparation for a new assault above the 4-hour moving averages (MA 50). The return into the ascending trendline could provide support for BTC/USD once more. Solid support would most likely be found above the $40,000 mark.
Note: Kryptomoney.com is not a financial advisor. Do your research before investing your funds in any financial asset or presented product or event. We are not responsible for your investing results
Image Credit: Shutterstock


Keep in mind that we may receive commissions when you click our links and make purchases. However, this does not impact our reviews and comparisons. We try our best to keep things fair and balanced, in order to help you make the best choice for you.
