The BTC/USD pair fell to $39,666 in September, indicating that Bitcoin’s historical context for the month stays negative for the crypto sector. However, in early October, everything changed: Bitcoin soared to $48,250. BTC prices surged over the weekend as investor confidence in the industry grew. On-chain data showed that Bitcoin’s hash rate surged close to an all-time high, prompting this increase. Today, BTC surpasses $50,000, and 10 leading cryptocurrencies are almost all in the green. As of the time of this post, BTC/USD records 5.50% daily and is currently trading near $50,100. The price of Bitcoin has risen dramatically in the first few days of October. It’s roughly up 20% from the September 29th low to today’s high at $50,380 on increased anticipation for a new bullish breakout. The growth of digital assets coincided with the rise in the price of stock indices like the S&P500 and Dow Jones.
Key Levels
Resistance Levels: $57,000, $55,000, $53,000
Support Levels: $47,000, $45,000, $43,000
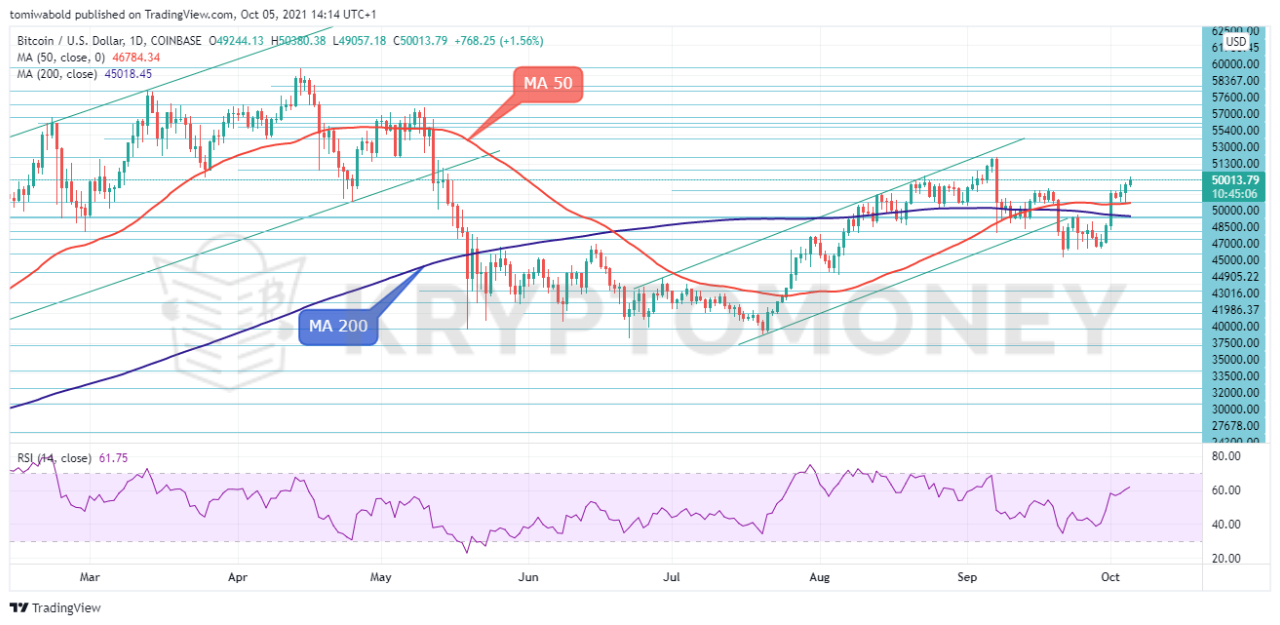
 BTC/USD Daily Chart
Following a weekend of increased volatility, Bitcoin has entered a bullish run. After bouncing significantly off around the $40,000 barrier last week, BTC/USD pierced through the moving average (MA 50) at $47,000 and now records an intraday-high past the $50,000 psychological zone. It’s critical for the price to stay above this zone, as history shows that the first time it’s retested, BTC tends to breakthrough.
It will be the initial key to creating bullish momentum that will push the lead crypto beyond the September high of $53,000 towards an all-time high of around $65,000. The Relative Strength Index (RSI) has been rising while the pair has formed a bullish continuation pattern. On the contrary, the downside pressure could return, with price targets of $47,000 and $45,000 indicating that the breakout was a bull trap rather than a positive reversal.
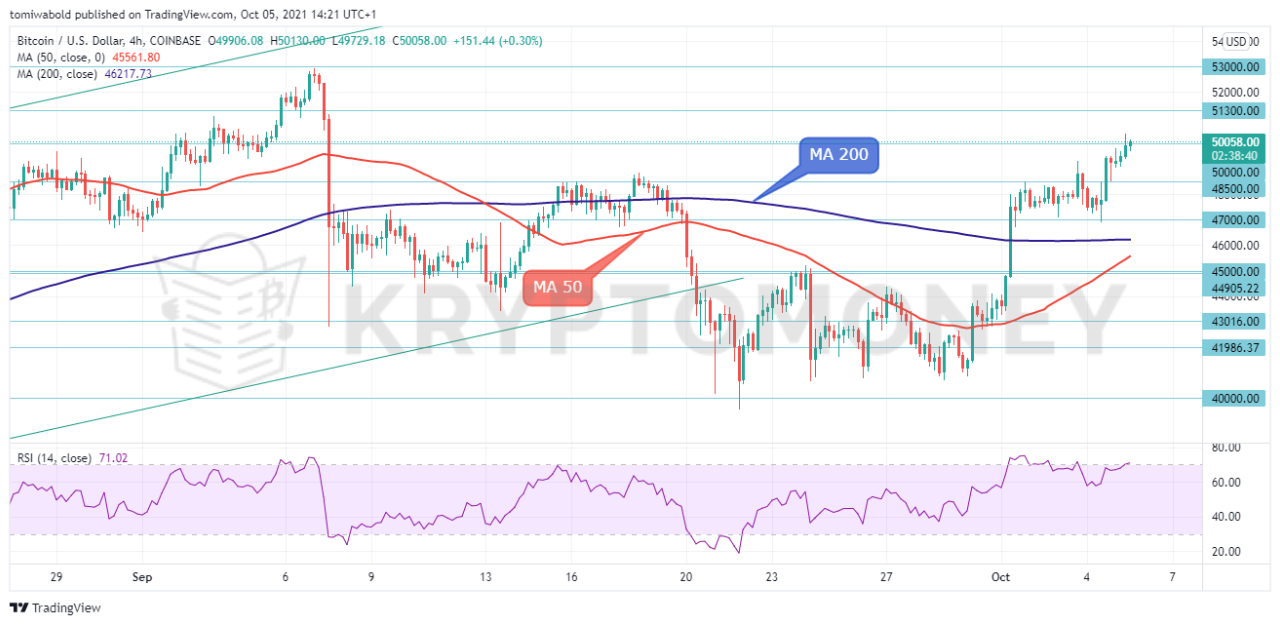
 BTC/USD 4-Hour Chart
After trading past the short-term moving averages (MA 50 and MA 200), BTC/USD has been treading water over the psychological level of $50,000. However, the bullish 4-hour Relative Strength Index in the demand zone indicates that selling has become less aggressive. The bulls must take out $51,300 before they could convince trend-followers of a turnaround.
Then, the September high of around $53,000 will be the next hurdle. Although, note that the mark could provide resistance and slow down a potential surge. On the other hand, a sustained breach of the $50,000 psychological level would almost immediately support the upside move. On the downside, a bearish breakout would trigger a wave of stop-losses, sending BTC towards the $45,000 zone.
Note: Kryptomoney.com is not a financial advisor. Do your research before investing your funds in any financial asset or presented product or event. We are not responsible for your investing results
Image Credit: Shutterstock
Keep in mind that we may receive commissions when you click our links and make purchases. However, this does not impact our reviews and comparisons. We try our best to keep things fair and balanced, in order to help you make the best choice for you.