
The crypto market has turned green since the recent correction, and the majority of the top 10 coins are bullish once more. Bitcoin (BTC) adoption takes off as institutions and individuals continue to jump on the digital currency bandwagon. As expectations of a sharp correction grew, Bitcoin’s price remained range-bound, fluctuating between $60,100 and $53, 966 in nearly two weeks. The BTC/USD has consolidated over the neutral $55,000 cloud, after improving from a recently formed floor at the $50,000 level. At the time of writing, BTC/USD is trading at $58,375 as buyers confront the reinforced border at $60k. The BTC market cap currently stands at $1.08 trillion, with $8.32 billion traded in the past 24 hours. According to Glassnode BTC’s long-term holder net position change for the first time during this bull run, Bitcoin holders are increasing their position size. The last time this happened BTC traded under $10,000 and that implies a positive holder net position not reflecting Bitcoin Price.
*Bitcoin’s price remained range-bound, fluctuating between $60,100 and $53, 966
*BTC/USD is trading at $58,156 as buyers confront reinforced border at $60k
*BTC Holder net position not reflecting Bitcoin Price
Key Levels
Resistance Levels: $65,000, $62,000, $60,000
Support Levels: $57,000, $55,400, $53,000
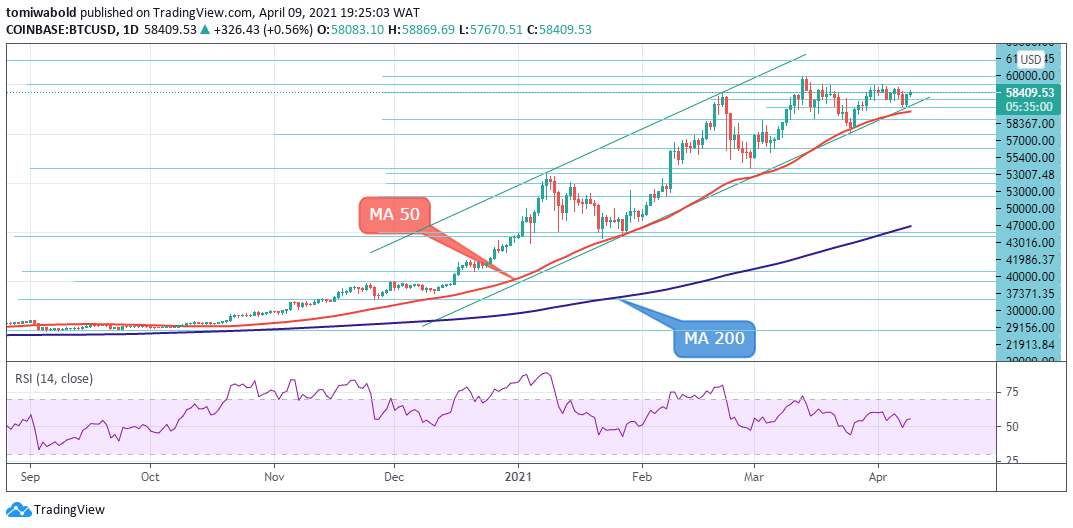
The BTC price trades along with the moving average (MA 50) and it has been shielding the bears’ attack since late Jan. 2020, while the climbing MA 50 also provides a footing for the price to recoup some lost ground. BTC/USD momentum seems to have evaporated and the merged flattening MA 50 lines are not transmitting any directional price preference indicating a calm before the storm. The price above $58,000 gathers strength for a push above the reinforced $60,000 border.
Regardless of the FUD, Bitcoin price has shown its resilience since its break past the $20,000 psychological zone and structured support levels which is strong to withstand any sudden plunge. BTC/USD support level at $50,000 held its ground amid the recent correction as buyers re-emerge from the zone stronger to launch past the $60,000 border towards $65,000. The benchmark support has risen to $50,000, with $40,000 reflecting a more severe downside risk.
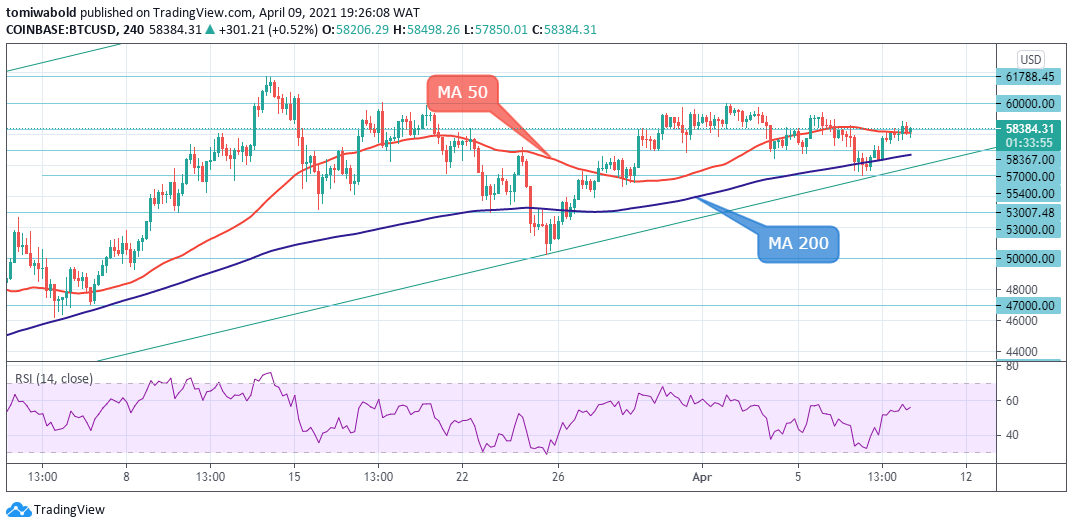 BTC/USD 4-Hour Chart
On the smaller time frame, BTC has two supports in the MA 50 and MA 200 acting as a launchpad for the pair. The 4-hour MA’s beneath price is endorsing positive sentiment as the RSI, which has rebounded a tad off the 50 levels. BTC price above a horizontal level at $58,367 is a catalyst for bulls to launch against the $60,000 border.
On the contrary, the recent bearish impulse to $55,400 is suggesting negative pressures may overpower any efforts to step above the borderline at $60,000. For the borderline barrier to secure the pair’s negative trajectory, it will need to redirect the price beneath the above-mentioned zone as well as the MA 50 at a $58,367 minor base. Overall, BTC/USD remains positively skewed to the upside based on its technical history.
Image Credit: Shutterstock


Keep in mind that we may receive commissions when you click our links and make purchases. However, this does not impact our reviews and comparisons. We try our best to keep things fair and balanced, in order to help you make the best choice for you.