
Highlights
The fresh selloff was seen in Bitcoin (BTC) as we enter into the weekend. As for the week, BTC is set to end as one of the worst-performing, along with XRP and ADA amongst the first 10 top cryptocurrencies. Despite the dips, buyers remain undaunted above $47,500 support on advancing MA 200 defending the uptrend. Earlier the bulls tried to acquire footing off the $50,000 support and pushing past these obstacles, the $53,000 handle may then step into the spotlight. The market cap is currently $928 billion, with $57.3 billion traded in the past 24 hours. The current spot price is down around 25% from the all-time high established on Apr. 14 and down nearly 0.5% in the past 24hrs. Nearly all crypto assets have suffered double-digit declines over the past week. At press time BTC/USD is trading at $49,333. The creator of the stock-to-flow model, PlanB, believes that the price of Bitcoin based on the stock-to-flow model is a healthy correction. “Nothing goes up in a straight line,” PlanB said in a tweet on Friday. “I’m kind of glad that the price of BTC is now again below the value of the S2F model,” he wrote in a conversation with the author of The Bitcoin Standard Saifedin Ammous, who called his predictions “astonishing”.
Key Levels
Resistance Levels: $60,000, $57,600, $53,000
Support Levels: $47,000, $45,000, $43,000
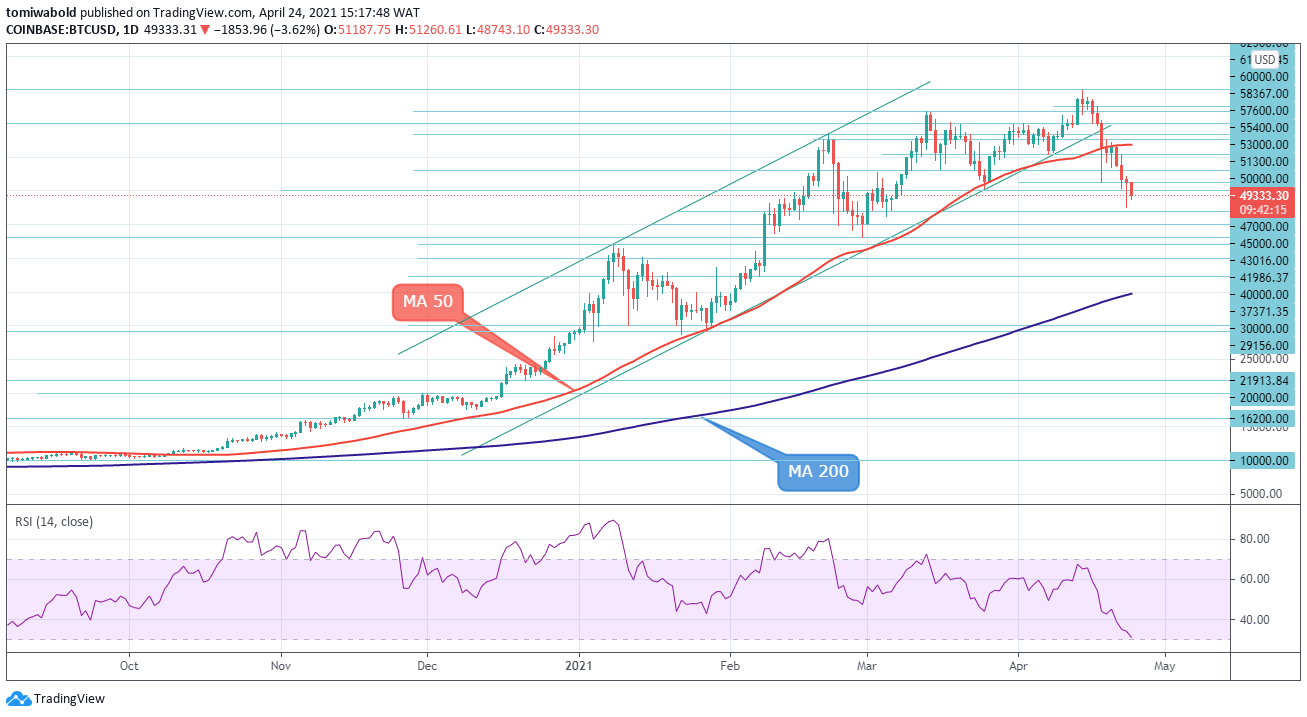 BTC/USD Daily Chart
Technically, a break of the BTC/USD support at $50,000 is another sign of Bitcoin’s weakness, and it could head to the next support region below $47,000. If selling interest picks up, sending the pair below the recent low of $47,500, early caps could develop from the nearest $45,000 low before the support section at $43,000-40,000 triggers a deeper bounce.
The negatively charged Relative Strength Index (RSI) is directed towards the oversold zone, contributing to an additional decline in the pair. The price below the 50 MA red line may fluctuate in the support area and bounce higher, breaking the obstacles in front of $50,000. If additional strength emerges, the bulls could break the $53,000 level and approach the multi-year high of $64,899.
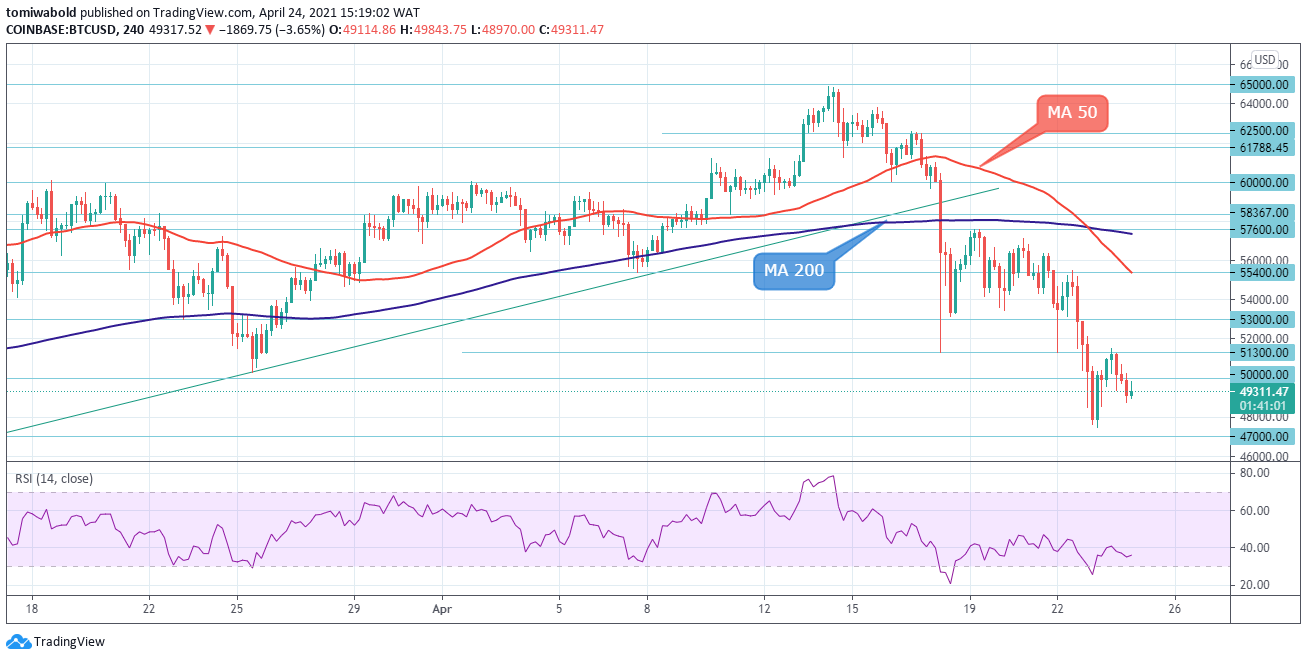 BTC/USD 4-Hour Chart
Bitcoin fell below the $50,000 support as Altcoins selling increase and the fall in BTC/USD shows little sign of stopping. The bullish inverted head and shoulders pattern is now invalidated as a warning that the price may drop to the $47,000- $45,000 threshold. An important pivotal swing low, around $51,300, now act as immediate resistance from former pivotal support.
The 4-hour moving average (MA 50), crossing the moving average (MA 200) down, confirms the bearish momentum in the short term. Meanwhile, the ranging RSI line below 50 reflects the relatively weak price movement after pulling back from the all-time high of $64,899, while the near-term picture indicates a decline. The BTC/USD pair is bullish only when it trades above the $51,300 level, with key support at the $47,000 and $45,000 levels.
Note: Kryptomoney.com is not a financial advisor. Do your research before investing your funds in any financial asset or presented product or event. We are not responsible for your investing results
Image Credit: Shutterstock


Keep in mind that we may receive commissions when you click our links and make purchases. However, this does not impact our reviews and comparisons. We try our best to keep things fair and balanced, in order to help you make the best choice for you.