
Bitcoin (BTC) had a massive rally in 2021 and remained in a daily uptrend despite the recent sell-off. Concerns over BTC sustaining its upside run have been dominating crypto space and the global financial markets over the past few weeks. Most digital currencies in growth with overstretched valuations have seen their prices plunge and some have even erased a chunk of their market cap. However, BTC buyers remain unfazed towards a $60k psychological level. The retreating price has led to profit-taking on the BTC/USD pair at the $57,402 level in the prior day. The current BTC/USD spot price is up 30% from the recent low established in Feb. 2021. With a current market cap of $1.02 trillion, and a total of $54.38 billion in trade volume over the past 24 hours. Bitcoin is trading at $55,607 following a recent rejection from levels slightly under the $57,000 high region. Bitcoin on-chain metrics as seen in a stable funding rate paired with a record-high $20.3 billion open interest on BTC futures are bullish indicators that suggest that the current rally has room to extend higher.
*The retreating price have led to profit-taking on the BTC/USD pair at the $57,402 level in the prior day
*However BTC buyers remain unfazed towards the $60k psychological level
*Bitcoin on-chain metrics flash bullish
Key Levels
Resistance Levels: $60,000, $58,367, $57,402
Support Levels: $53,000, $50,000, $47,000
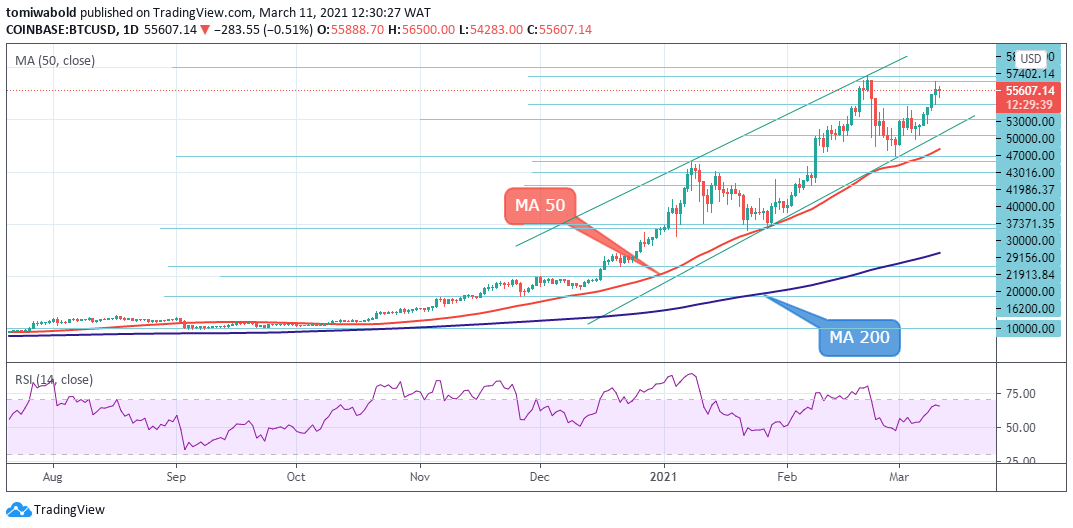 BTC/USD Daily Chart
The technical perspective of the daily chart suggests a minor RSI relative strength index (RSI) divergence near the overbought area was a sign of a loss in the bullish momentum. Then an over 2000-pip drop to intraday low level of $54,283. Meanwhile, the MA 5 remains unfazed by the retreat and no confirmation of overextension yet.
The BTC/USD pair may attempt testing its first key support at $53,000 if ever sellers hold such a conviction. A yet overbought RSI indication could attract some bear hunters. Though a failure to hold on to that level may trigger a deeper retreat towards $50,000. But all in all, the BTC/USD buyers remain unfazed towards the $60k psychological level and beyond.
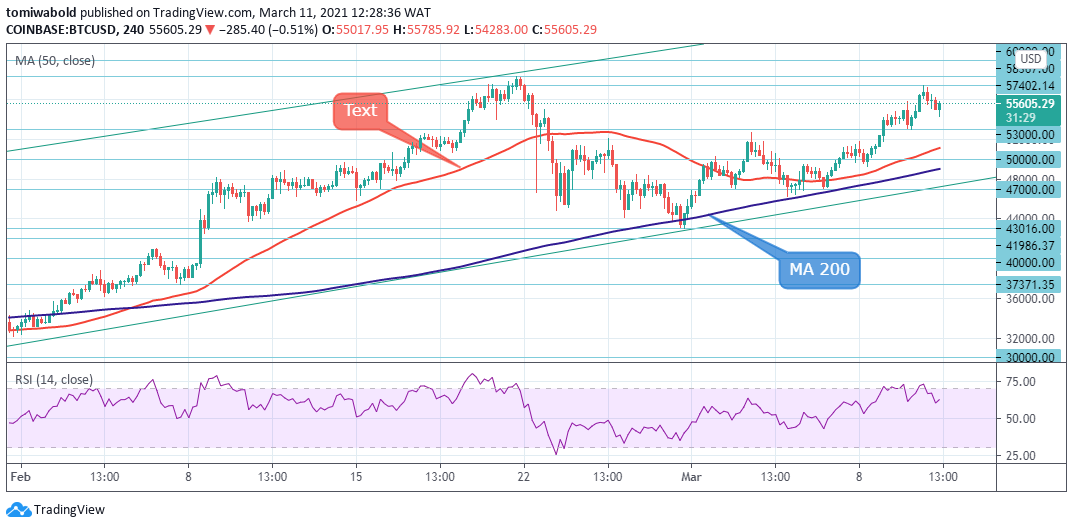 BTC/USD Daily Chart
Bitcoin (BTC) is now staging a minor bounce amid a strong retreat lower on Thursday after hitting a new monthly trading high, around the $57,402 mark. The BTC/USD pair is showing that the 4-hour trend stays inside the ascending channel. The MA 50 and 200 stays beneath the price hence the bulls remain in play.
Traders should also be aware that the double top scenario takes place after the bulls failed to break yesterday’s February high. The BTC/USD pair is bullish only when it exchanges beyond the $53,000 level, with key resistance at $57,402 and $58,367. If the BTC/USD pair is trading beneath the $53,000 level, sellers may attempt the $53,000 and $47,000 levels.
Note: Kryptomoney.com is not a financial advisor. Do your research before investing your funds in any financial asset or presented product or event. We are not responsible for your investing results
Image Credit: Shutterstock


Keep in mind that we may receive commissions when you click our links and make purchases. However, this does not impact our reviews and comparisons. We try our best to keep things fair and balanced, in order to help you make the best choice for you.
