
The crypto ecosystem gets set for bulls as the ground goes green even after the Market plunge lately. Interestingly, the rebound has guided with Bitcoin leaping past $9,500, one that returns its total market capitalization to the same figures reported on June 14 at $175 billion after a slight decline on Monday. BTC/USD is up 1.15 percent from the open value of $9,429.73 to trade at $9,592 intra-day high. Market volatility has increased despite downside crack as Bitcoin is relentless on its $10,000 journey, once the $9,600 hurdle gets breached. As per Glassnode, the number of Bitcoin whales hit levels last recorded before the 2017 bull run that marks a nearly 10% rise from the past year. Since January 2020, the number of Bitcoin holders with more than 1000 BTC has steadily grown and hit 1882 by now, while more than 75 holds more than 10,000 BTC and just 7 holding more than 100,000 BTCs.
*BTC/USD is up 1.15 percent from the open value of $9,429.73 to trade at $9,592 intra-day high
*Market volatility has increased despite downside crack and Bitcoin is relentless on its $10,000 journey
*As per Glassnode, the number of Bitcoin whales hit levels last recorded before 2017 bull run which marks a nearly 10% rise from the past year
Key levels
Resistance Levels: $10,500, $10,000, $9,500
Support levels: $9,200, $8,800, $8,500
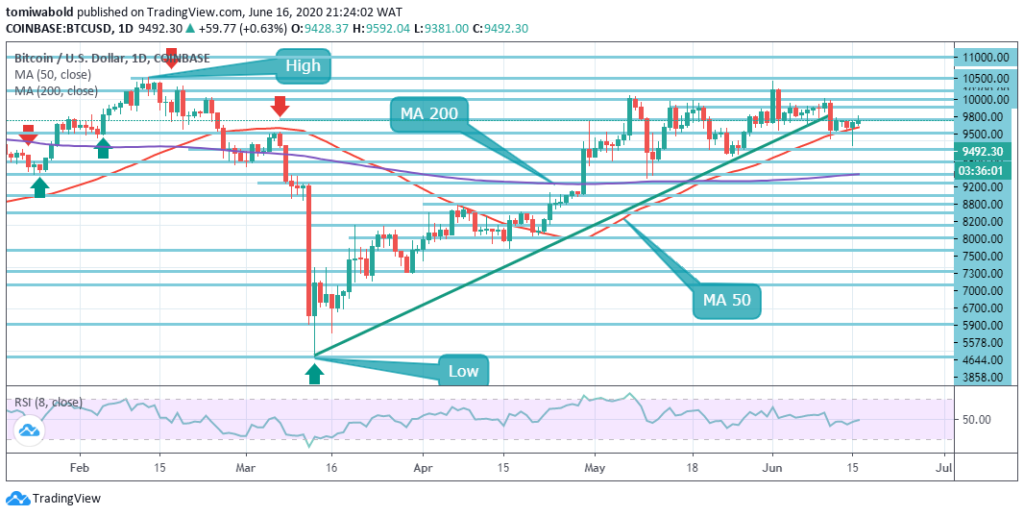 BTC/USD Daily Chart
Bitcoin has rallied toward the $9,600 area of resistance, and the journey to $10,000 is likely to persist. During the rebound from the $8,900 level, a bullish reversal trend with about $600.00 of growth potential was established. Traders might also consider that if bulls rally through the $9,600 level, the bullish trend may get switched on. Bitcoin price is above the MA 50; possibly deliver $9,200 in support as the BTC/USD price today holds the ground at $9,492.30.
Besides, the rebound from the fall initially soared beyond the horizontal resistance that resulted in a $9,500 breakout. The BTC/USD pair is only bullish while still trading beyond the level of $9,200; key resistance is found at the levels of $9,500 and $10,000. If the BTC/USD pair trades beneath the level of $9,200, sellers may test the support levels of $9,000 and $8,800.
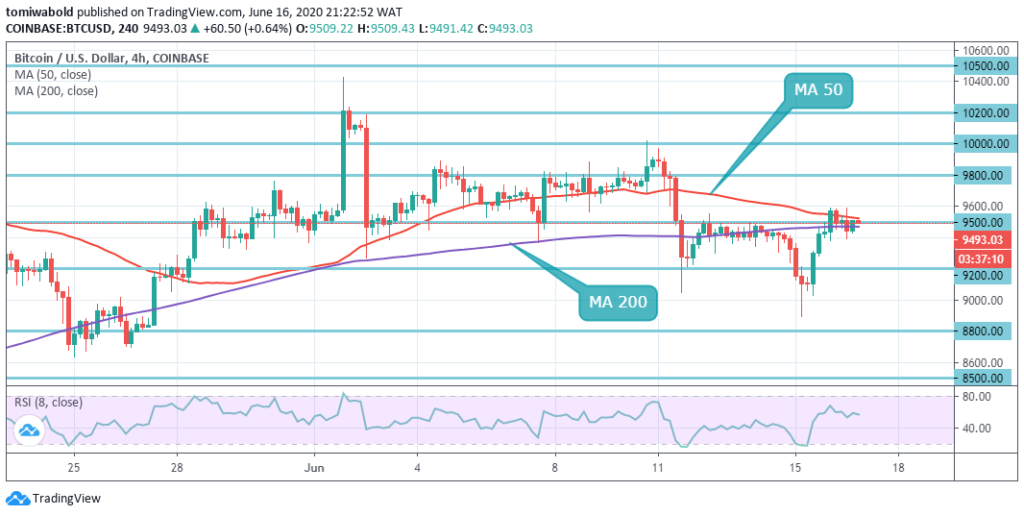 BTC/USD 4-Hour Chart
Bitcoin returned between the structure of 4 hour MA 50 and MA 200 and tested its upper limit at $9,550 all through early American hours. Despite the recovery, the short-term trend stays sideways from the $8,973 intraday low, BTC/USD is shifting within a strong high volatility trend. A steady step over the channel resistance created at $9,500 level by the upper border of the horizontal line may accelerate the bullish pressure and drive the token toward a $10,000 psychological zone.
Once this obstacle gets removed, the upside trend with the emphasis on $10,428 (June 1 high) may probably gain traction. $10,500 is followed, which is the highest level of the year. On the drawback, a continuous shift beneath 4 hours MA 200 at $9,450 and the lower edge of the horizontal support line at $9,200 level may weaken the analytical picture and enable an extensive sell-off to $9,000.
Note: Kryptomoney.com is not a financial advisor. Do your research before investing your funds in any financial asset or presented product or event. We are not responsible for your investing results
Image Credit: Shutterstock


Keep in mind that we may receive commissions when you click our links and make purchases. However, this does not impact our reviews and comparisons. We try our best to keep things fair and balanced, in order to help you make the best choice for you.