
Today’s crypto markets are range-bound, with traders appearing to be holding their bets until the conclusion of the week. Bitcoin is making a modest recovery while trading below the $40,000 barrier level. BTC/USD plummeted to a low of $30,000, before closing the prior week at $34,627. This zone should give significant support for the bottom end of the range to settle and consolidate in the future. At the time of writing, BTC is awaiting a breakout while trading at $38,657 below the moving average (MA 200). Soon after the world’s most valuable cryptocurrency reached an all-time high of $64,899, the RSI indicator showed that the asset was overbought, signaling a gradual markdown. Tesla then liquidated 10% of its Bitcoin assets announcing that it would no longer accept Bitcoin payments due to the high energy consumption of the Bitcoin mining process, causing investors to panic. As Elon Musk’s Bitcoin influence wanes, many analysts realize BTC was overbought at the time of the crash and required a catalyst to fix itself with his tweet only serving as a spark for the crypto market’s long-awaited correction.
Key Levels
Resistance Levels: $47,000, $43,000, $40,000
Support Levels: $37,000, $33,500, $30,000
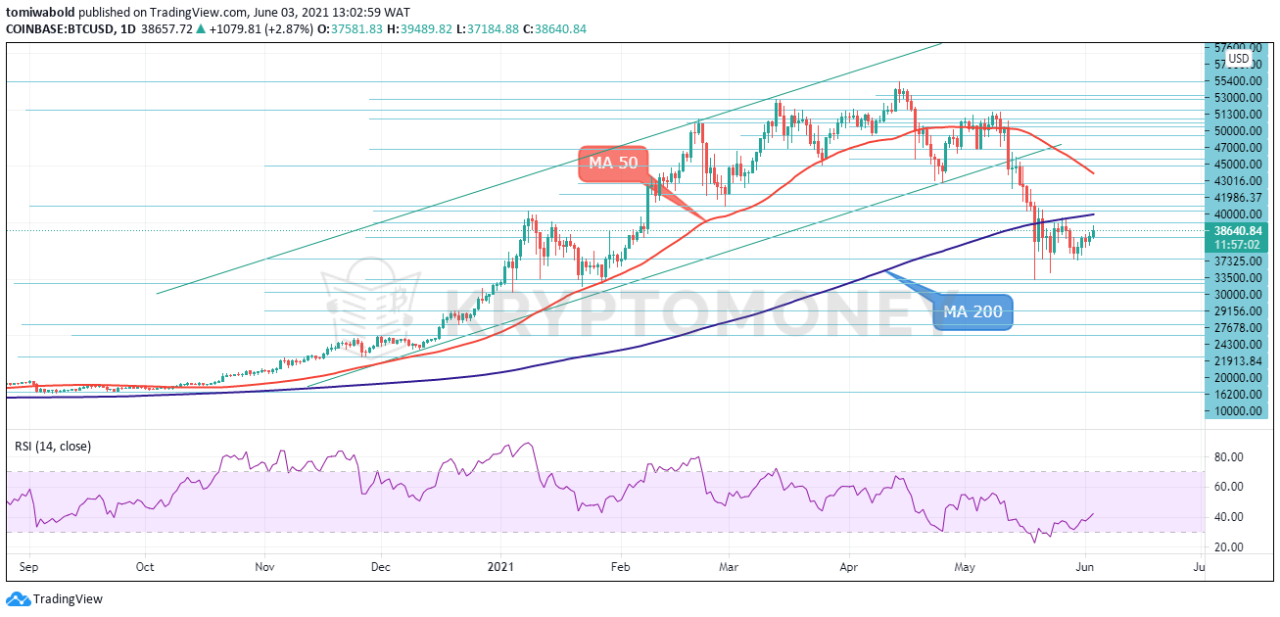 BTC/USD Daily Chart
Despite today’s rally, the trend remains range-bound on Bitcoin in the near term. BTC/USD support is at $37,325 and on the upside, the resistance is at $40,000. The next committed move in Bitcoin is more likely to go up than down as long as these levels remain intact. It could also enter the next important support zone between $33,500, $30,000, and $27,678 if it fell further.
These zones should give significant support for the bottom end of the range to settle and consolidate in the future. The BTC/USD pair should climb past the $40,000 level if advances above $37,000 are sustained. The pair is expected to break out higher, with bulls aiming for the next resistance level of $43,000. Nonetheless, there is a slim probability that the $47,000 support turned resistance will be broken any time soon.
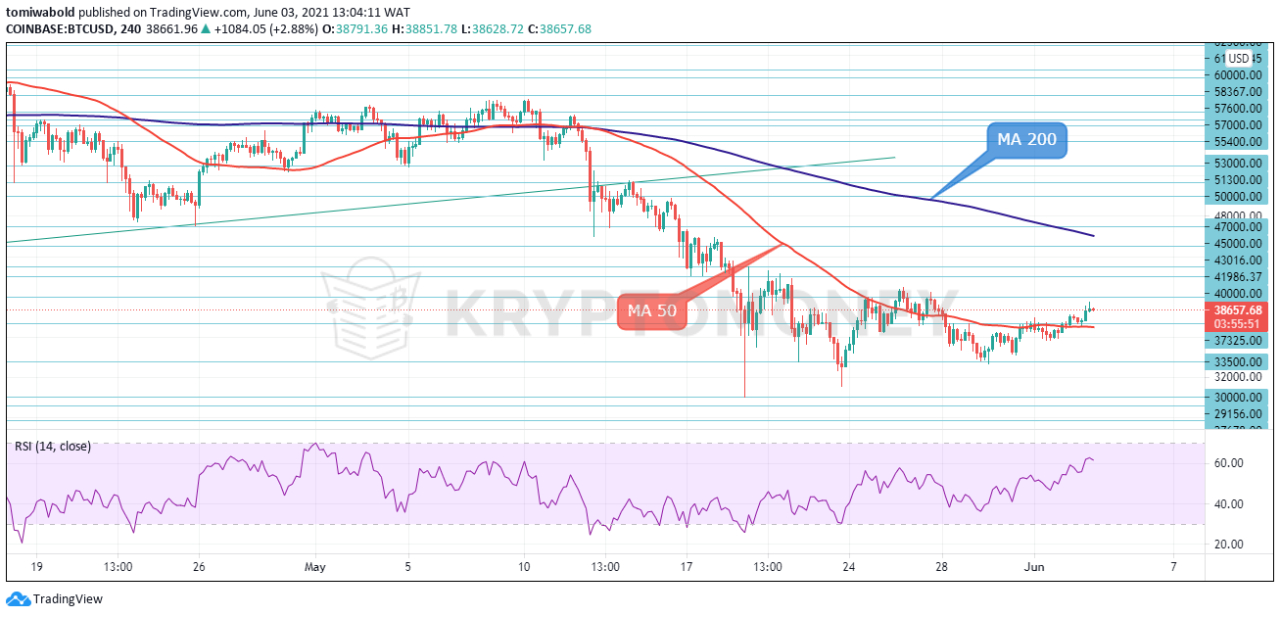 BTC/USD 4-Hour Chart
The BTC/USD pair is above yesterday’s high of $38,237 at the time of analysis. The pair is just above the moving average (MA 50) on the four-hour chart. It’s also around the retracement level of 23.6 percent, and the Relative Strength Index (RSI) is forming a bullish pattern and above its midlines 50. The pair is expected to break out higher, with bulls aiming for the next resistance level of $43,000.
If the $40,000 barrier is not broken, the BTC/USD pair may fall below the moving average (MA 50) and $37,000 support area on an intraday basis. The BTC/USD pair is only bullish if it is trading above $37,000; significant resistance levels are $43,000 and $47,000. Sellers may test the $33,500 and $30,000 levels if the BTC/USD pair goes below $37,000.
Note: Kryptomoney.com is not a financial advisor. Do your research before investing your funds in any financial asset or presented product or event. We are not responsible for your investing results
Image Credit: Shutterstock


Keep in mind that we may receive commissions when you click our links and make purchases. However, this does not impact our reviews and comparisons. We try our best to keep things fair and balanced, in order to help you make the best choice for you.