
Bitcoin, No.1 cryptocurrency spends one more day to determine which direction to take but also it drains the investors’ confidence. The largest global cryptocurrency, which now has a $179.7 billion market cap, is presently consolidating in between $9,771 following an 11.18 percent spike after Monday’s halving. Bitcoin is grappling to reinforce gains toward $10,000 for over five days now as a massive directional break is predicted on BTC/USD. The recovery action comes ever since BTC/USD plunged from highs past $10,400 to $9,270. As per the news report, an ETC Company based in London launch Bitcoin (ETP) on the German stock exchange, the financial regulator BaFin granted BTCE approval in March. The crypto-currency community was optimistic over BTCE’s launch as a boost to BTC adoption and a positive one for its price.
*Bitcoin is grappling to reinforce gains toward $10,000 for over five days now as a massive directional break is predicted on BTC/USD
*The recovery action comes ever since BTC/USD plunged from highs past $10,400 to $9,270
*An ETC Company based in London launch Bitcoin (ETP) on the German stock exchange, the financial regulator BaFin granted BTCE approval in March
Key Levels
Resistance Levels: $11,000, $10,500, $10,000,
Support levels: $9,200, $8,800, $8,500
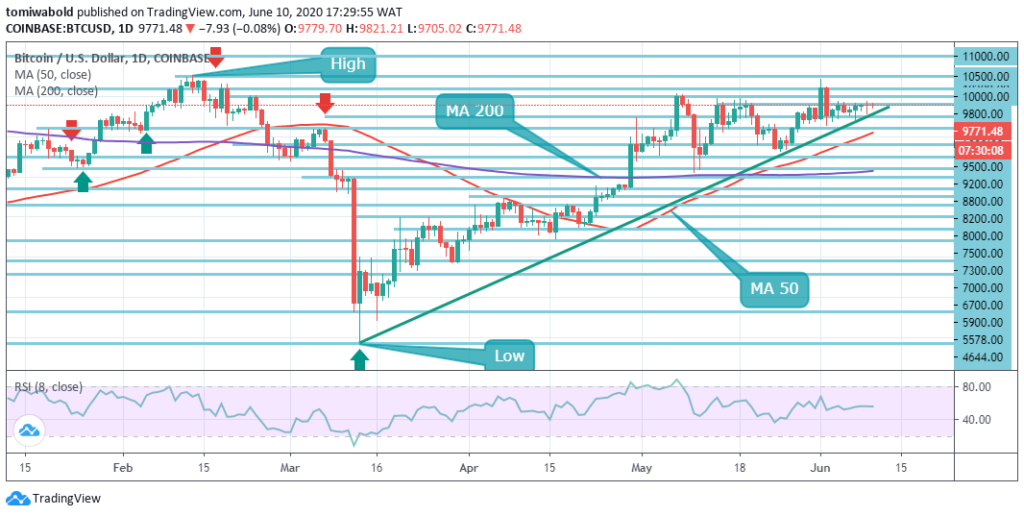 BTC/USD Daily Chart
BTC/USD is stuck in a narrow range beneath $10,000, as seen on daily. Thus far the recent efforts to hold over this psychological barrier have largely failed. When out of the path, the positive side is capable of gaining momentum towards $10,522 with it being the highest level in 2020. The initial crucial hurdle drops at $9,000, on the downside. The daily MA 50 bolsters it, shielding price from a sharper collapse to $8,000 with daily MA 200 located around this boundary.
At the time of posting Bitcoin is exchanging at $9,771 with next to no price activity in the day. The ascending trendline is one of the key considerations for which direction Bitcoin is most inclined to take. Since 12 March the bulls have succeeded in defending this trendline formation. The most recent decline to the trendline and the MA 50 occurred on May 25 when BTC reported an $8,632 low. The trendline, however, served as a launchpad and bulls forced Bitcoin back over the MAs and resumed the uptrend.
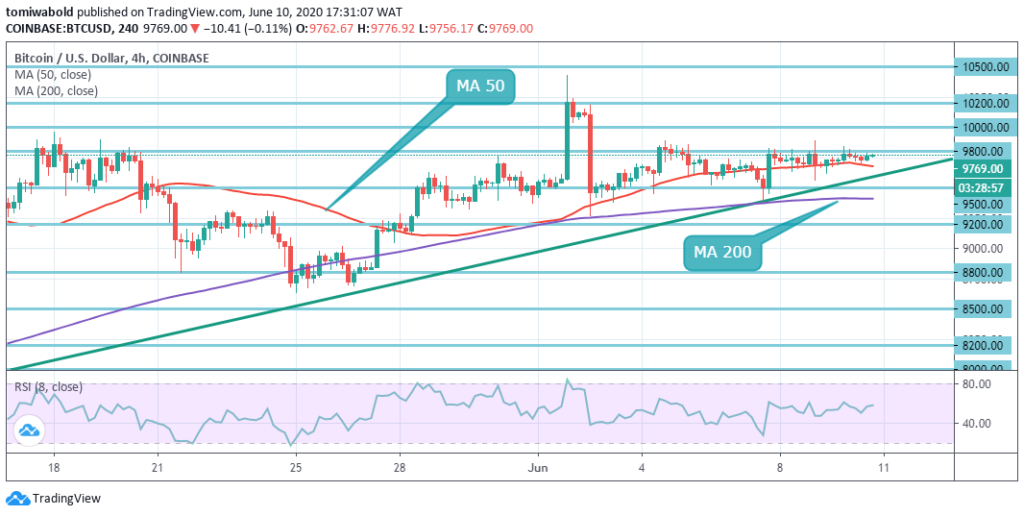 BTC/USD 4-Hour Chart
As the number one crypto-currency moves within an overly limited price range, Bitcoin seems to be positioning for a wide directional leap. Medium to short-term bulls may be gearing up again this week to strike to the $10,500 resistance level. Except for a few volatile candlesticks, the 4-hour chart is relatively flat.
The technical analysis outlines that the BTC/USD pair testing toward the support area of $9,200 may see a breakout underneath the $8,800 level. The BTC/USD pair is bullish whilst still trading beyond the level of $9,200, key resistance is identified at levels of $10,000 and $10,500. When the BTC/USD pair sells beneath $9,200, sellers may test the support levels of $8,800 and $8,500.
Note: Kryptomoney.com is not a financial advisor. Do your research before investing your funds in any financial asset or presented product or event. We are not responsible for your investing results
Image Credit: Shutterstock


Keep in mind that we may receive commissions when you click our links and make purchases. However, this does not impact our reviews and comparisons. We try our best to keep things fair and balanced, in order to help you make the best choice for you.